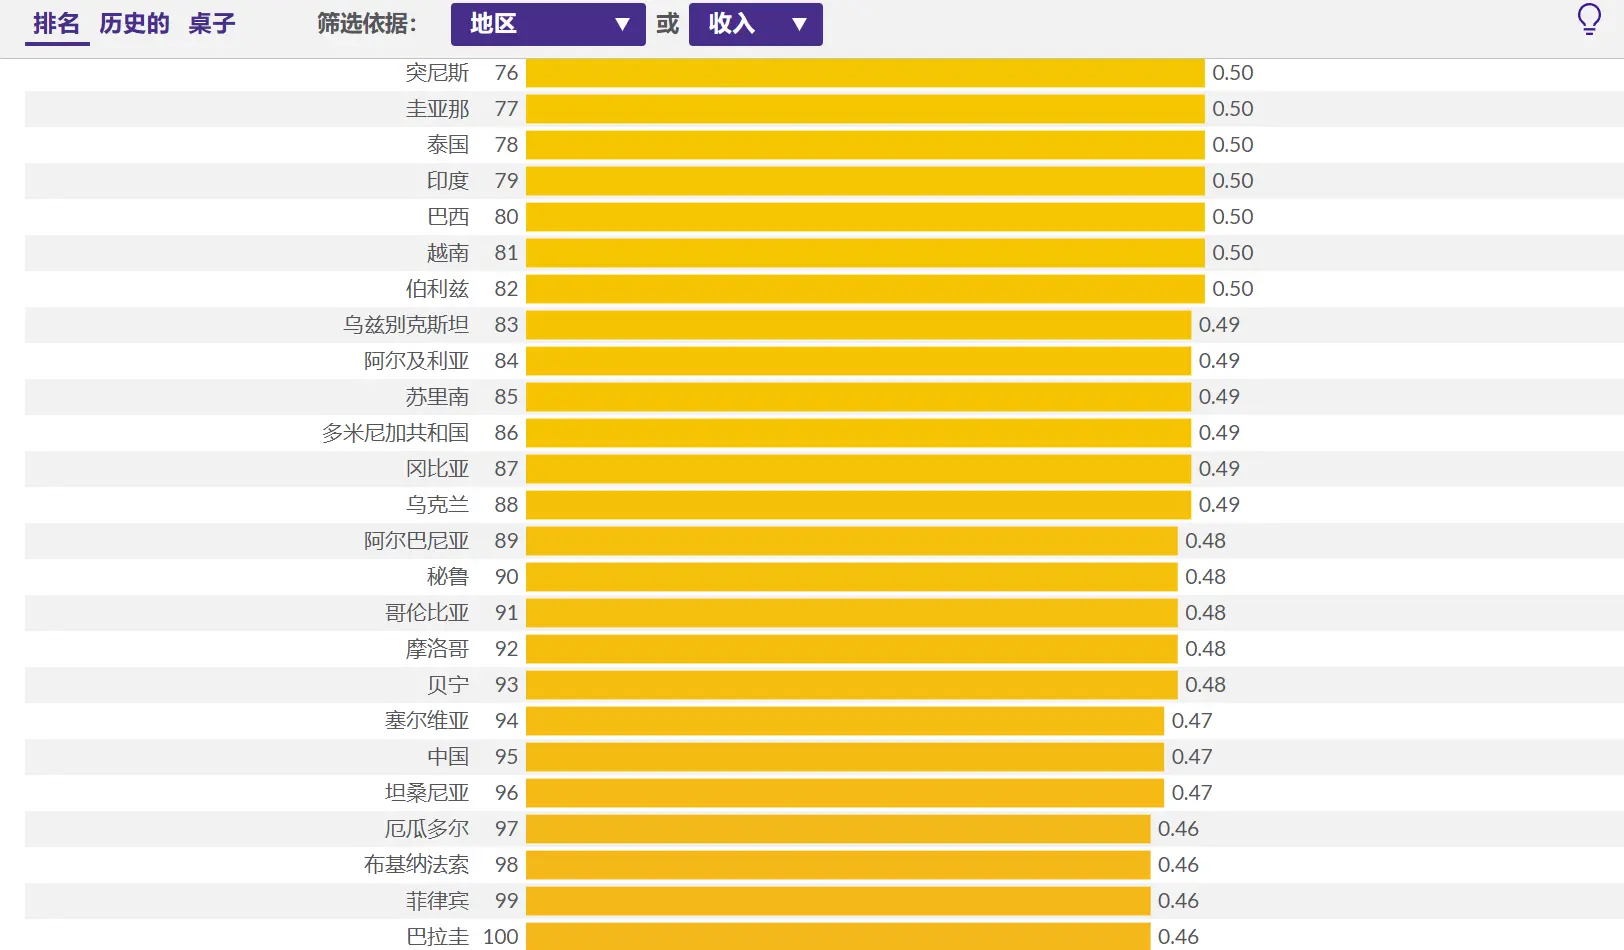
Today, I saw someone sharing the Global Corruption Perceptions Index (CPI) ranking in a WeChat group. China ranked 76th globally, on par with Moldova and the Solomon Islands, only 5 points higher than India, and 40 to 50 points lower than European countries. My intuition told me that this index might be flawed. China has been seriously tackling deep-rooted corruption in recent years, so it doesn’t make sense for its ranking to drop so significantly. Upon further investigation, I found that this index is truly jaw-dropping.
The So-Called Global Corruption Perceptions Index is Essentially a Second-Hand Index
On the official website of Transparency International, the Global Corruption Perceptions Index (CPI) is described as follows:
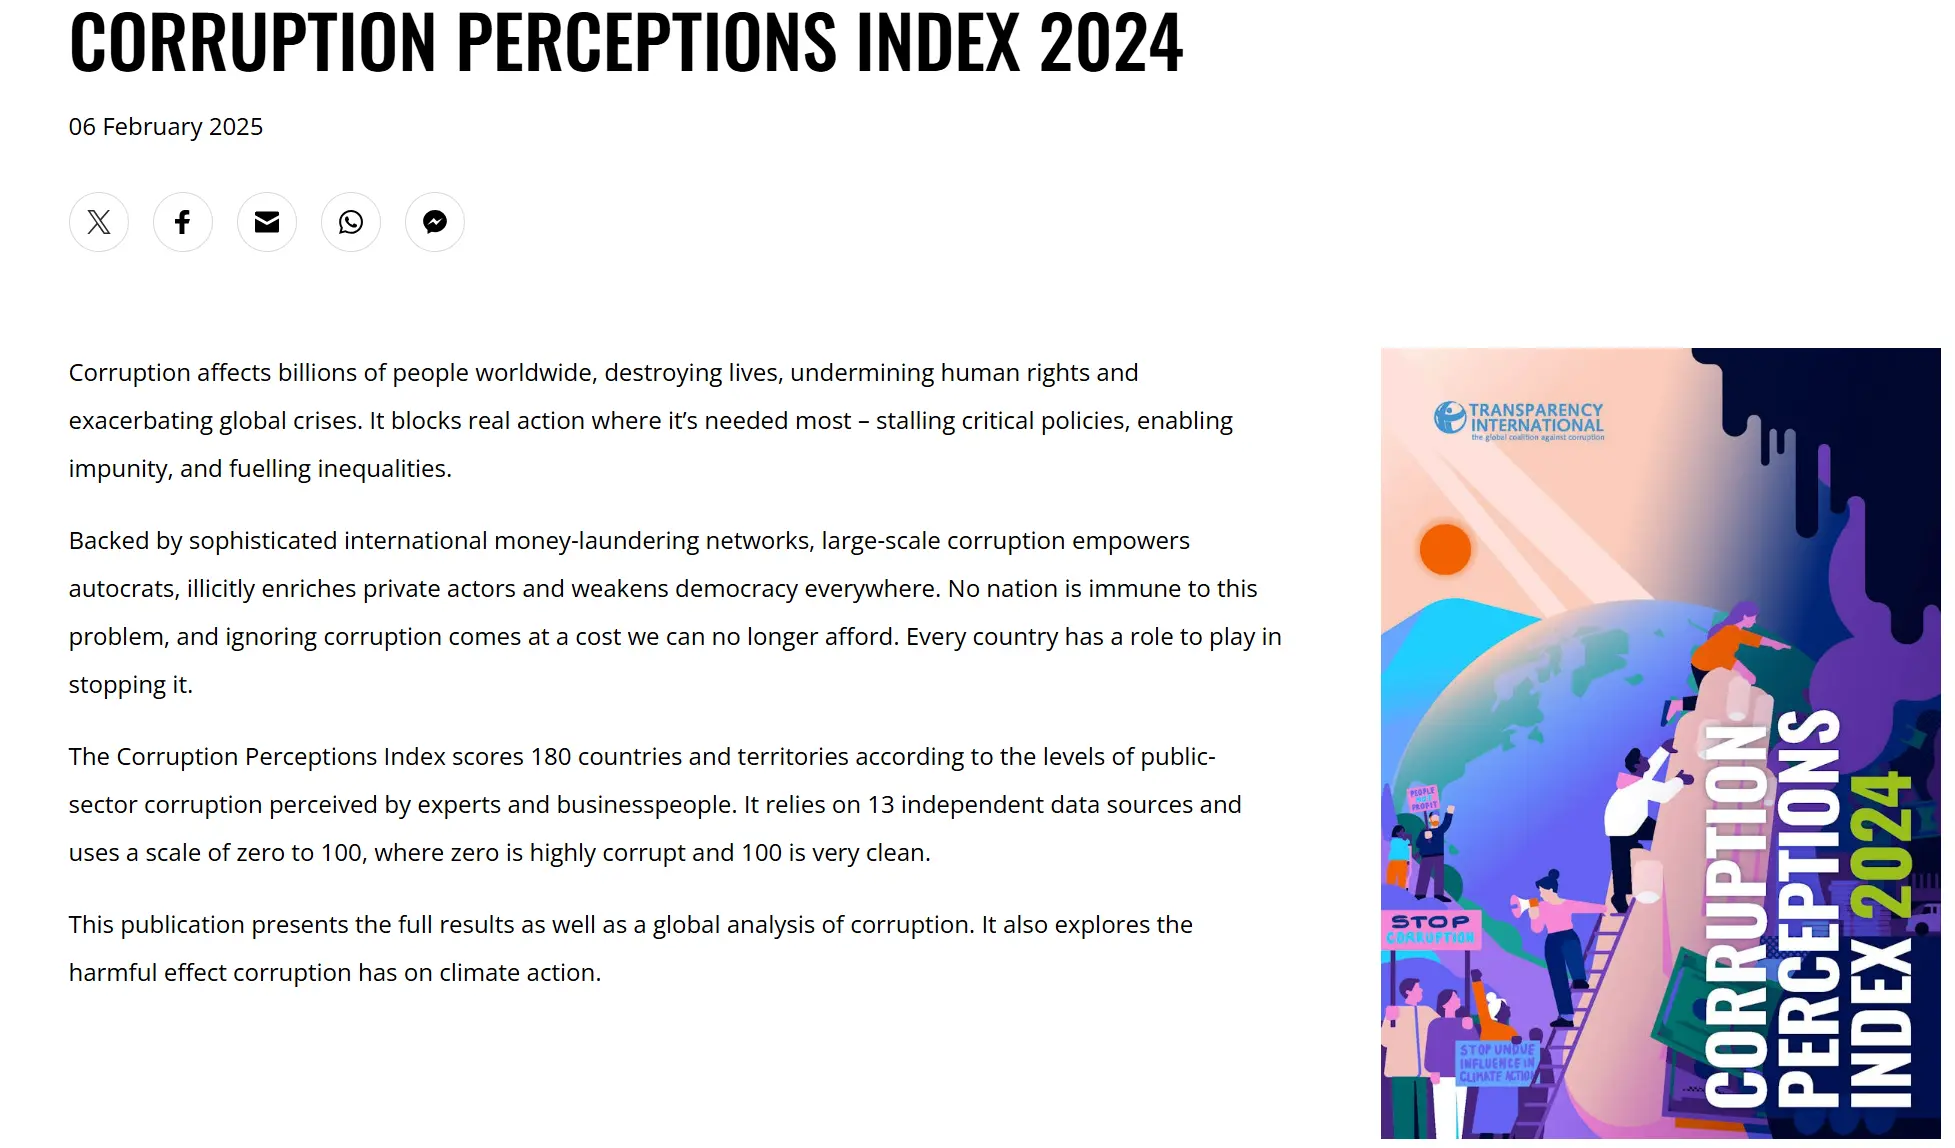
The Corruption Perceptions Index scores 180 countries and territories according to the levels of public-sector corruption perceived by experts and businesspeople. It relies on 13 independent data sources and uses a scale of zero to 100, where zero is highly corrupt and 100 is very clean.
However, upon opening the report, I found that its research methodology is:
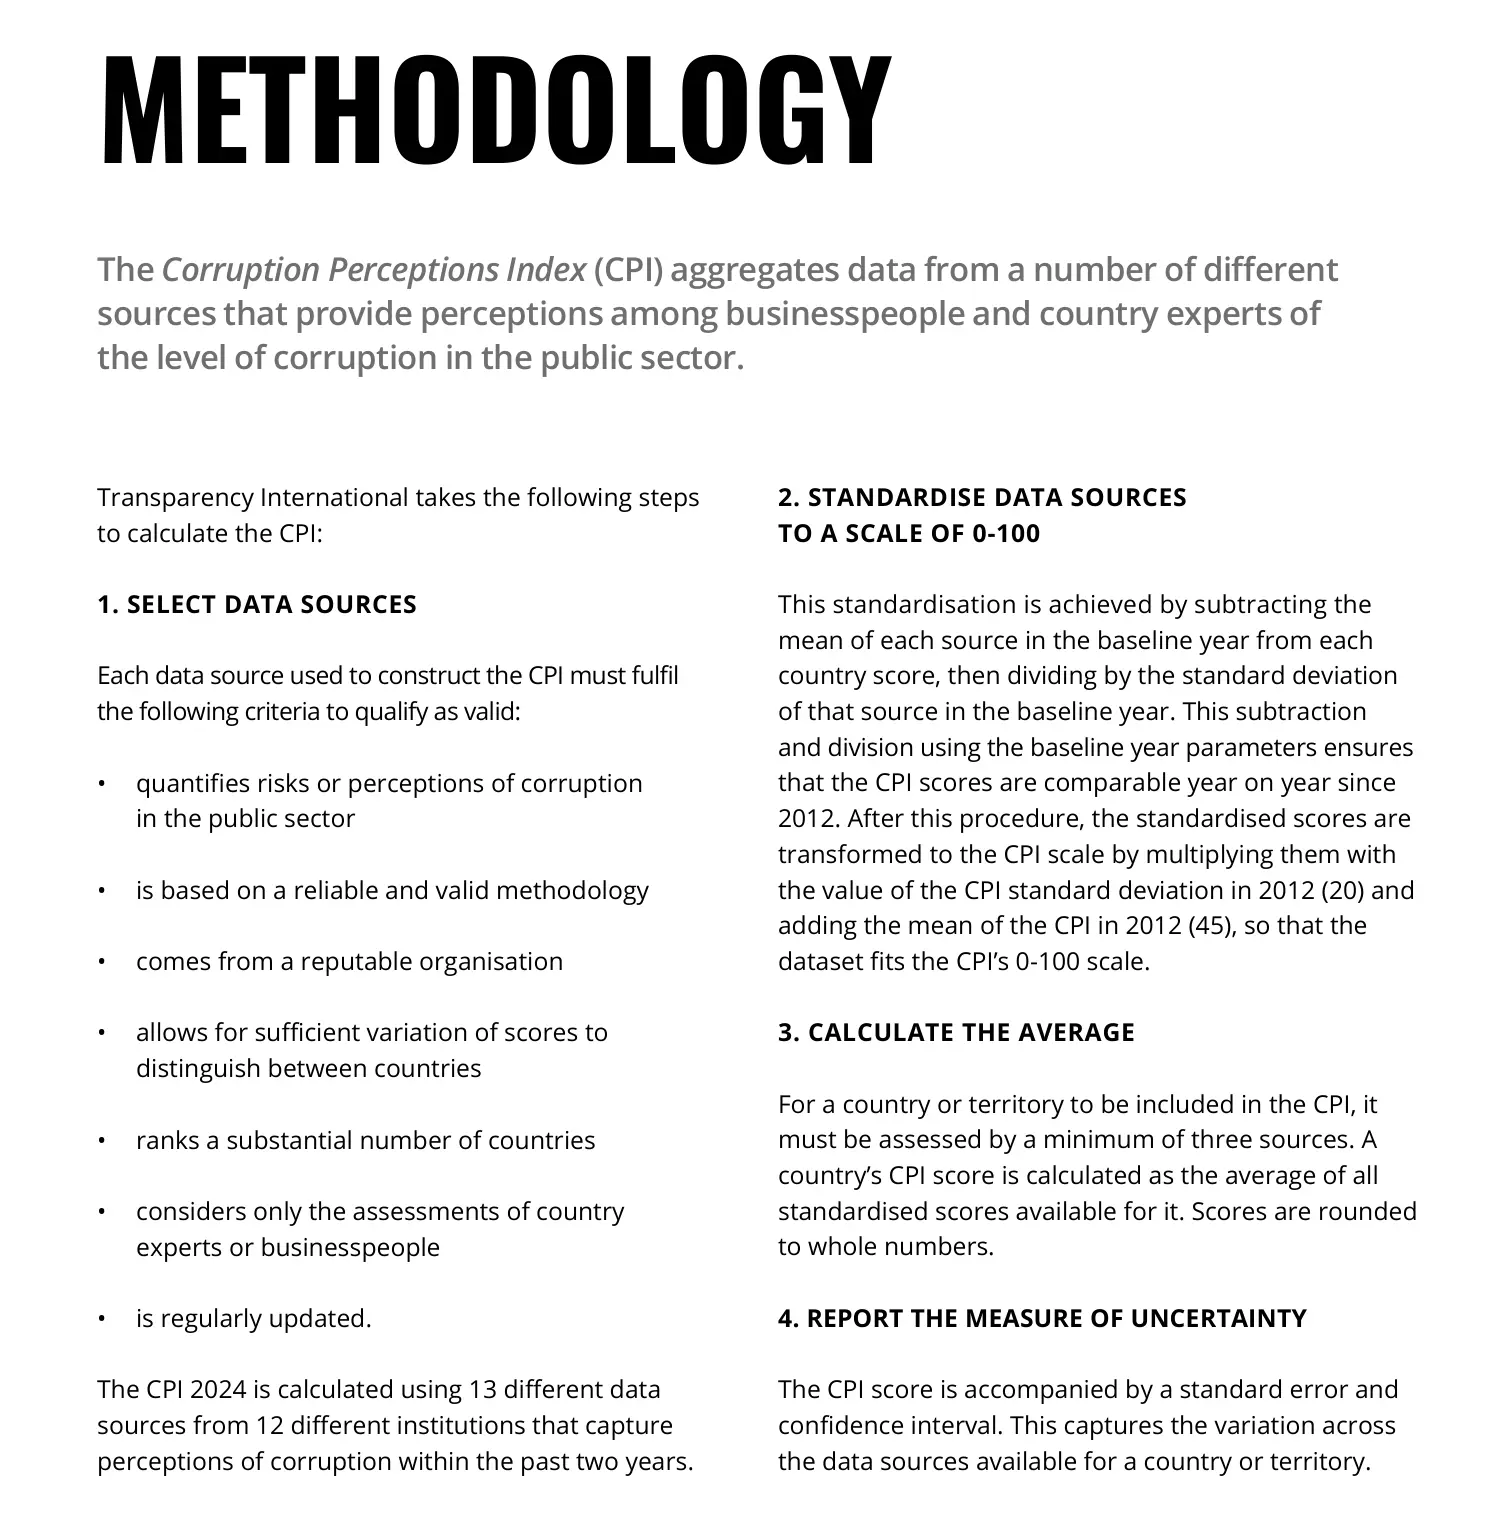
The CPI 2024 is calculated using 13 different data sources from 12 different institutions that capture perceptions of corruption within the past two years.
Upon comparison, the report states that the CPI is based on 13 independent data sources and calculated using purely mathematical methods such as standard deviation and variance. There is no weighting system; it essentially aggregates a bunch of so-called international rankings to produce the final “Corruption Perceptions Index.” Without a doubt, it is a “second-hand index.”
Misleading Index Description
Let’s look at the two descriptions above. The report states that the research method is: the CPI is calculated based on 13 independent data sources, providing insights into the level of public-sector corruption for businesses, countries, and experts.
The Corruption Perceptions Index (CPI) aggregates data from a number of different sources that provide perceptions among businesspeople and country experts of the level of corruption in the public sector.
However, on the report’s introduction page, the research method is described as: the CPI scores 180 countries and territories based on the perceived levels of public-sector corruption by experts and businesspeople. It relies on 13 independent data sources and uses a scale of zero to 100, where zero is highly corrupt and 100 is very clean.
The difference lies in the fact that the introduction page claims that the CPI is based on “the perceived levels of public-sector corruption by experts and businesspeople,” while the actual report states that the CPI is a second-hand index aggregated from 13 independent data sources, providing insights into the level of public-sector corruption for businesses, countries, and experts.
The introduction page is clearly misleading, intending to make readers believe that the CPI is derived from surveys of experts and businesspeople, when in reality, it is not.
A Carefully Designed Calculation Trap
The CPI uses a purely mathematical calculation method. It standardizes the scores by subtracting the mean value of each source in the baseline year and then dividing by the standard deviation of that source in the baseline year. Additionally, this subtraction is converted to the CPI scale by multiplying the standardized score by the CPI standard deviation value of 2012 (20) and adding the 2012 mean value (45).
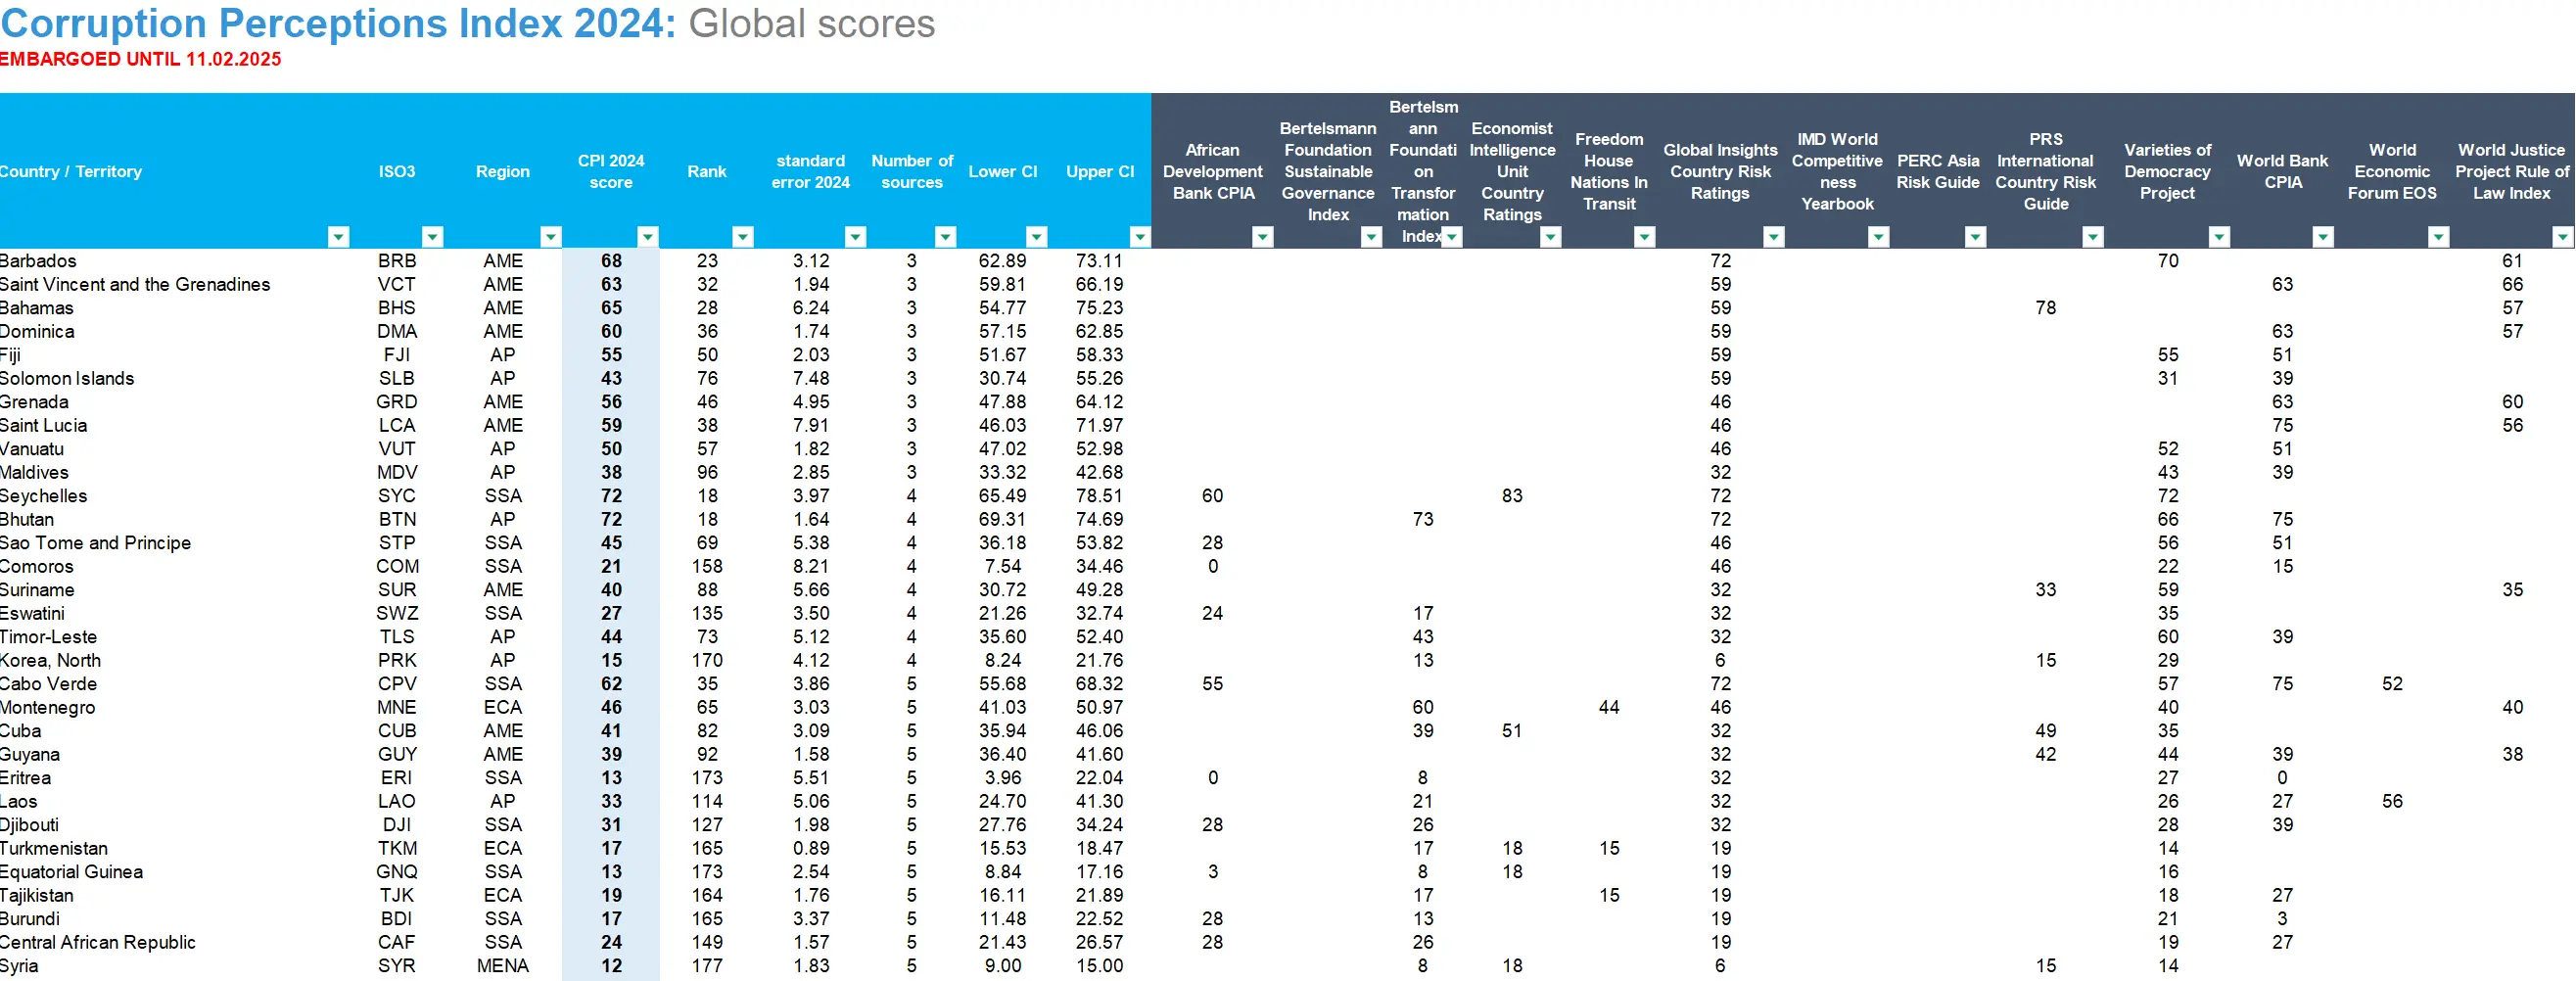
While this algorithm itself is not inherently problematic, a closer look at the raw scoring data reveals that most countries in the CPI’s 13 data sources have only 7-8 data points, and many countries have as few as 3-5 data points.
In such cases, using the aforementioned mathematical calculations can easily amplify the final score differences, creating a calculation trap.
- Amplifying Differences: The CPI’s standardization is based on the distribution of the baseline year (e.g., 2012 mean and standard deviation). However, if some countries were already at extreme positions (e.g., very high or very low scores) in the baseline year, their differences in subsequent years will be continuously amplified.
- Fixed Parameter Limitations: The CPI forces scores into the 0-100 range using the formula
z×20+45. However, if extreme z-values (e.g., z=3) exist in the raw data, the converted score would exceed 100 (e.g., 105), and in practice, it might be truncated to 100. This artificially creates a “ceiling effect,” where a few high-scoring countries are clustered around 90+, while low-scoring countries are suppressed near 0. - Coverage Bias: Some data sources (e.g., reports from international organizations) tend to cover countries with higher governance levels or greater international attention, leading to more densely populated scores for these countries. Meanwhile, data for marginalized countries may rely on a few rough indicators, amplifying errors.
- Example:
Suppose Country A had a raw score of 90 in 2012 (baseline mean=60, standard deviation=15), resulting in a z-score=2 → CPI=2×20+45=85.
If in 2020, Country A’s raw score remains 90, but the average score of other countries drops to 50 (standard deviation remains 15), its z-score=2.67 → CPI=2.67×20+45=98.4. - Result: Even if the raw score remains unchanged, developed countries will be “amplified” to higher scores due to the global average CPI score dropping.
Carefully Selected Left-Wing Ideological Data
I thoroughly examined the 13 so-called independent data sources cited by the CPI. Upon investigation, I found that 9 of them have clear records of funding from the United States Agency for International Development (USAID). Among the remaining 4, two are suspected to be funded by USAID, and only two projects—S&P Ratings and the International Institute for Management Development (IMD)—have no clear funding information. With such a high concentration of left-wing influence, it’s almost fair to say that Transparency International’s so-called CPI is purely a left-wing ideological rating. Particularly notorious are organizations like Freedom House and The Economist, which are openly anti-China, almost wearing their bias on their sleeves.
1. African Development Bank Country Policy and Institutional Assessment (CPIA) (suspected USAID funding)
- Publisher: African Development Bank (AfDB)
- Main Content:
Assesses the quality of policies and institutional effectiveness in African countries, including dimensions such as economic management, public sector governance, social inclusion, and environmental sustainability, with a focus on the governance capacity of low-income countries. - Characteristics: Limited to African countries, used as a reference for international aid allocation.
2. Bertelsmann Foundation Sustainable Governance Index (SGI) (USAID funding)
- Publisher: Bertelsmann Foundation (Germany)
- Main Content:
Analyzes the sustainability of governance in OECD and some EU countries, covering policy performance, democratic quality, and international cooperation, emphasizing long-term governance capacity. - Characteristics: Focuses on Western governance models, with data based on expert assessments.
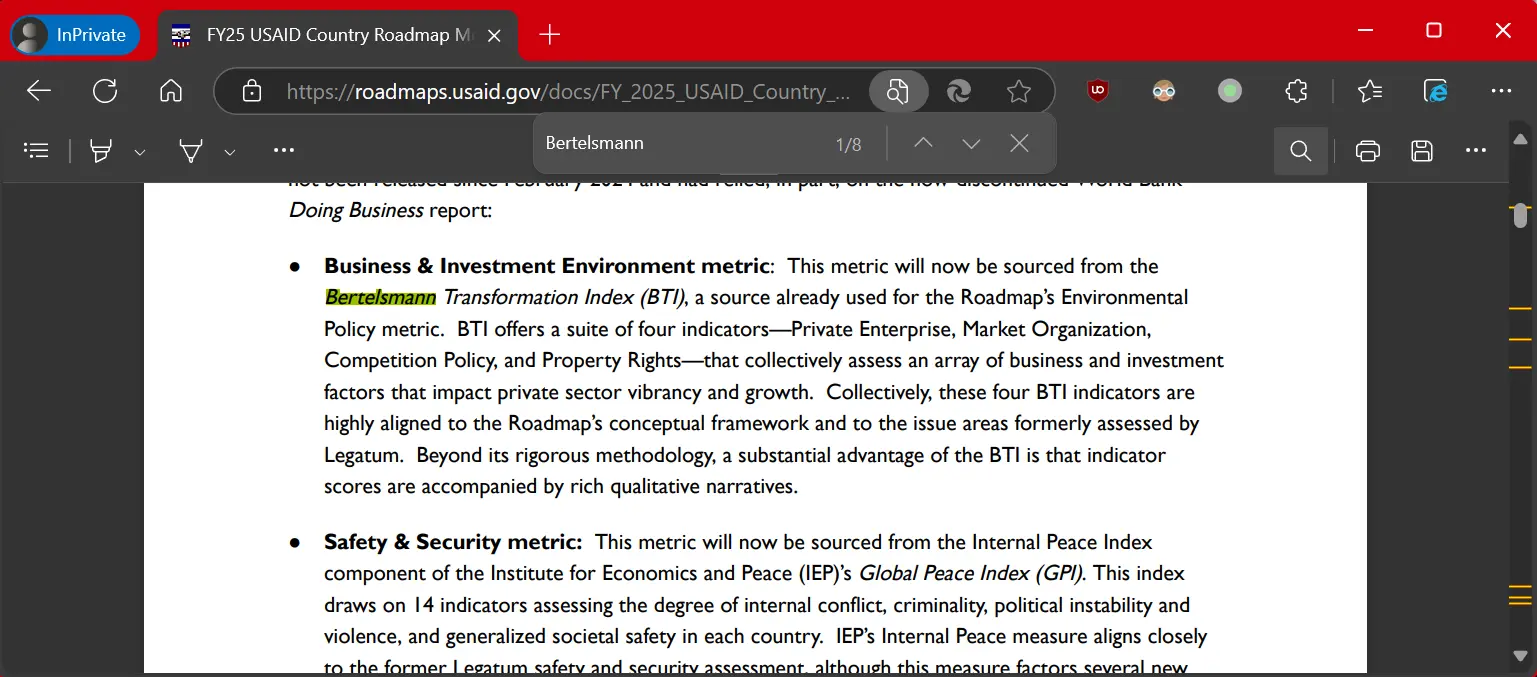
3. Bertelsmann Foundation Transformation Index (BTI) (USAID funding)
- Publisher: Bertelsmann Foundation
- Main Content:
Evaluates democratic development, market economy, and political stability in developing and transitioning countries worldwide, focusing on challenges and progress during national transitions. - Characteristics: Covers around 140 countries, updated biennially, combining quantitative and qualitative analysis.
4. Economist Intelligence Unit (EIU) Country Ratings (USAID funding)
- Publisher: Economist Intelligence Unit (EIU)
- Main Content:
Provides political risk, economic policy, business environment, and sovereign credit risk ratings for countries worldwide, with a focus on macroeconomic and geopolitical stability. - Characteristics: Widely used for cross-border investment and risk assessment, with a business-oriented perspective.
5. Freedom House Nations in Transit (USAID funding)
- Publisher: Freedom House (a U.S. NGO, added to China’s sanctions list in 2019 for its role in the Hong Kong protests)
- Main Content:
Monitors the democratization process in Central and Eastern Europe, Central Asia, and post-Soviet countries, assessing indicators such as electoral fairness, civil liberties, anti-corruption, and judicial independence. - Characteristics: Focuses on “transition countries,” with a clear pro-Western democratic stance.
6. Global Insights Country Risk Ratings
- Publisher: IHS Markit (now part of S&P Global)
- Main Content:
Evaluates political, economic, and security risks in countries worldwide, with a focus on short-term risk warnings (e.g., conflicts, policy changes) affecting business activities. - Characteristics: Serves businesses and investors, with high-frequency data updates.
7. IMD World Competitiveness Yearbook
- Publisher: International Institute for Management Development (IMD, Switzerland)
- Main Content:
Ranks the competitiveness of global economies, covering economic performance, government efficiency, business efficiency, and infrastructure, with extensive hard data (e.g., GDP, unemployment rates). - Characteristics: Diverse data sources, combining statistical data and executive surveys.
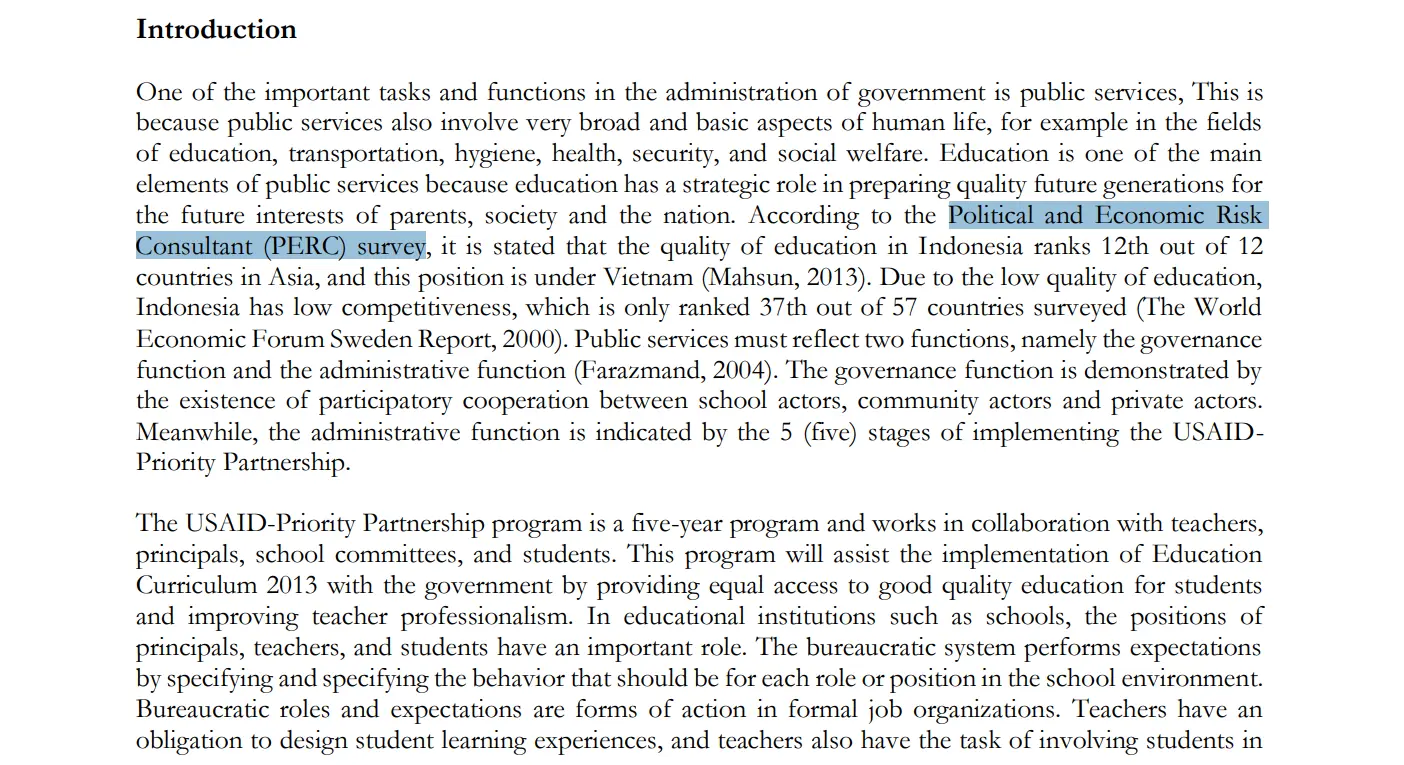
8. PERC Asia Risk Guide (USAID funding)
- Publisher: Political & Economic Risk Consultancy (PERC, headquartered in Hong Kong)
- Main Content:
Assesses business risks in Asian and Oceanian countries, including corruption, policy transparency, rule of law, and bureaucratic efficiency. - Characteristics: Focuses on the Asia-Pacific region, with data based on surveys of foreign business executives.
9. PRS International Country Risk Guide (USAID funding)
- Publisher: Political Risk Services Group (PRS)
- Main Content:
Quantifies political, economic, and financial risks in countries worldwide, predicting regime stability, expropriation risks, currency crises, etc. - Characteristics: Provides risk scores and rankings, commonly used in insurance and cross-border investment decisions.
10. Varieties of Democracy Project (V-Dem) (USAID funding)
- Publisher: Joint research project by the University of Gothenburg (Sweden) and the University of Notre Dame (USA)
- Main Content:
Provides the world’s most detailed dataset on democratic quality, covering dimensions such as electoral democracy, liberal democracy, participatory democracy, and deliberative democracy. - Characteristics: Extremely granular data (hundreds of indicators), but some indicators rely on subjective expert judgments.
11. World Bank Country Policy and Institutional Assessment (CPIA) (suspected USAID funding)
- Publisher: World Bank
- Main Content:
Evaluates the quality of policies and institutions in developing countries (primarily aid recipients), including economic management, structural reforms, social inclusion, and public sector governance. - Characteristics: Directly influences World Bank aid allocation, covering around 80 countries.
12. World Economic Forum Executive Opinion Survey (EOS) (USAID funding)
- Publisher: World Economic Forum (WEF)
- Main Content:
Collects perceptions of business environments in countries worldwide through surveys of global business executives, covering infrastructure and tourism, market vitality and capacity, innovation ecosystems, talent and employment, etc. - Characteristics: Data used for the Global Competitiveness Report, reflecting the perspectives of business elites.
13. World Justice Project Rule of Law Index (USAID funding)
- Publisher: World Justice Project (WJP, a U.S. non-profit)
- Main Content:
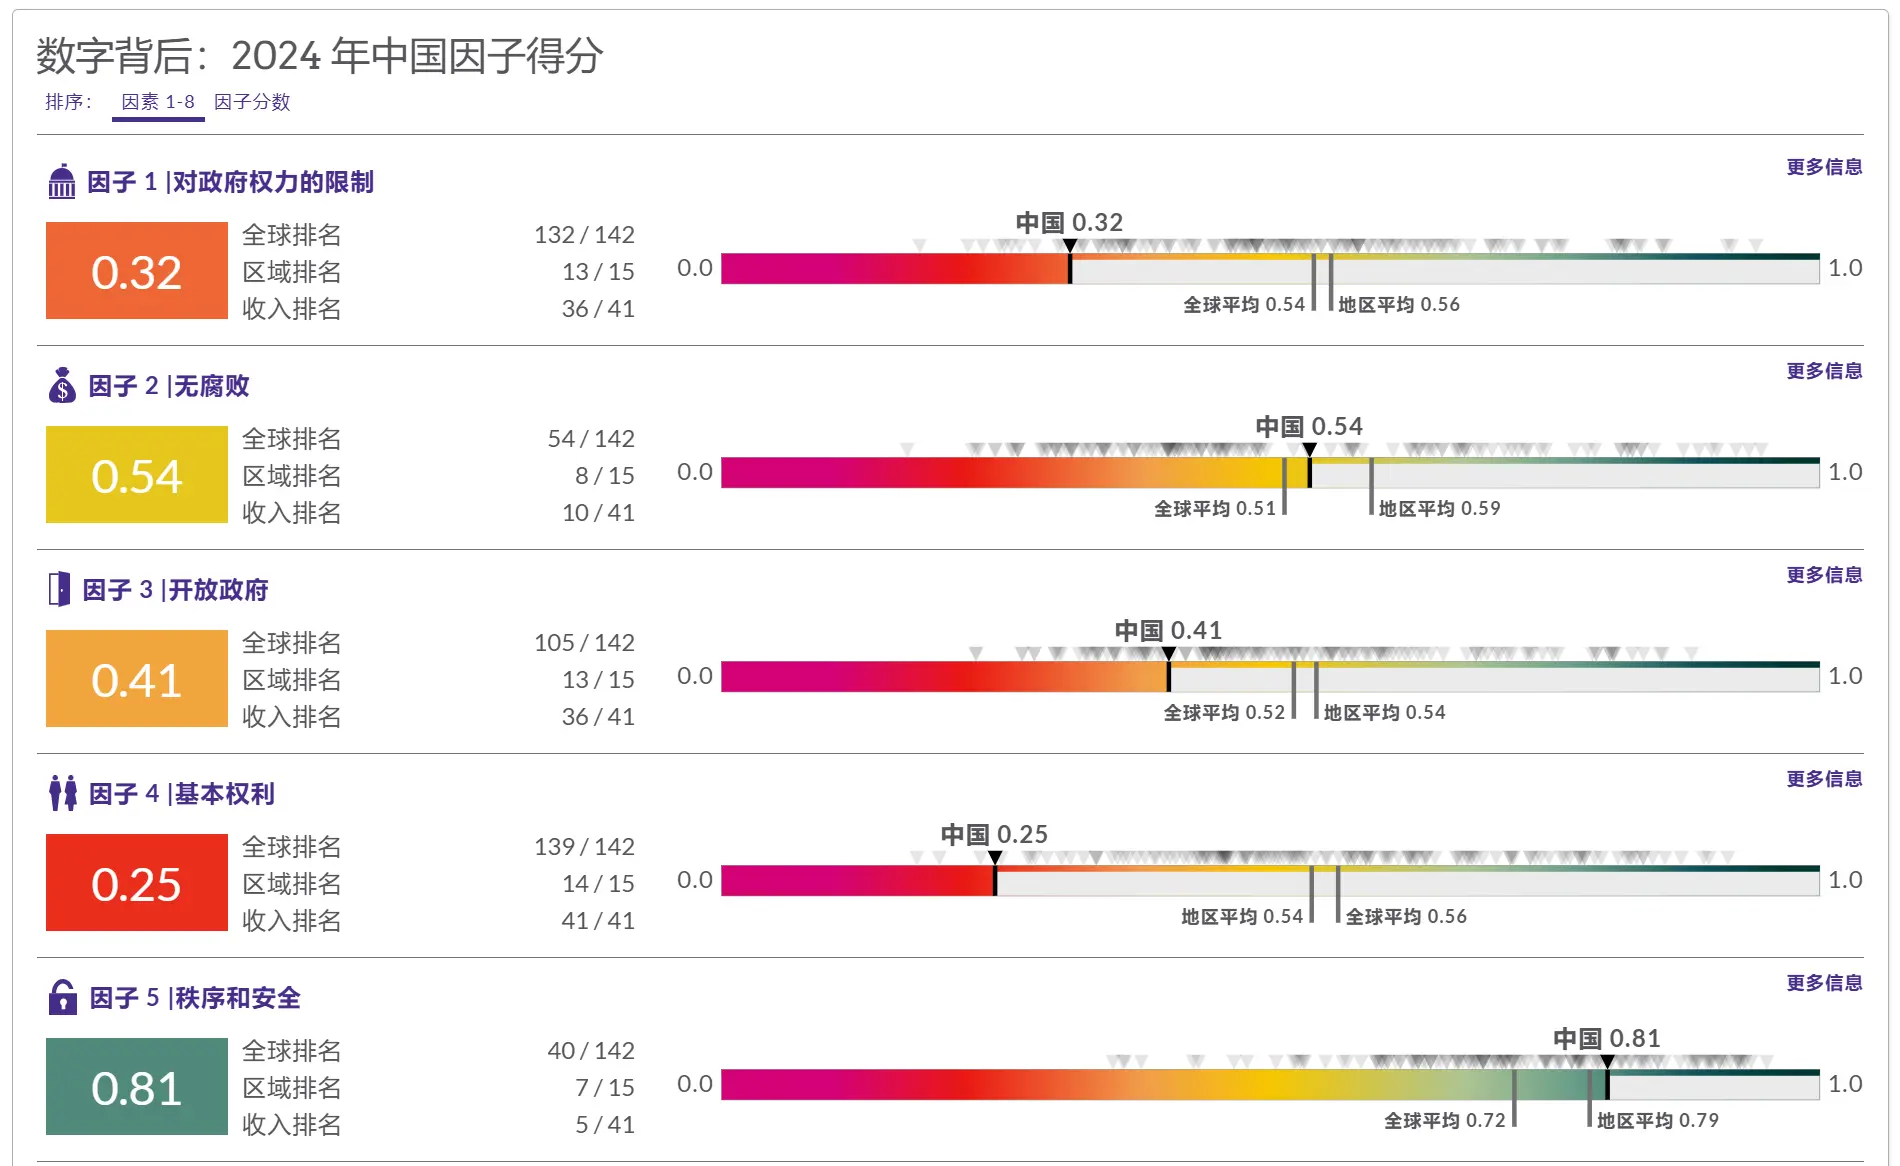
Measures the rule of law in countries worldwide, covering sub-dimensions such as constraints on government powers, judicial corruption, fundamental rights, criminal justice, and civil justice. - Characteristics: Data sources include public surveys and legal expert assessments, with a liberal rule-of-law perspective.

Data Sources Barely Related to Corruption
I examined the reports and background information of the 13 data sources mentioned above and found that only 3 of them are related to corruption, while the rest are broad indicators of democracy, governance, rule of law, etc. Even these 3 data sources that include corruption are of questionable quality.
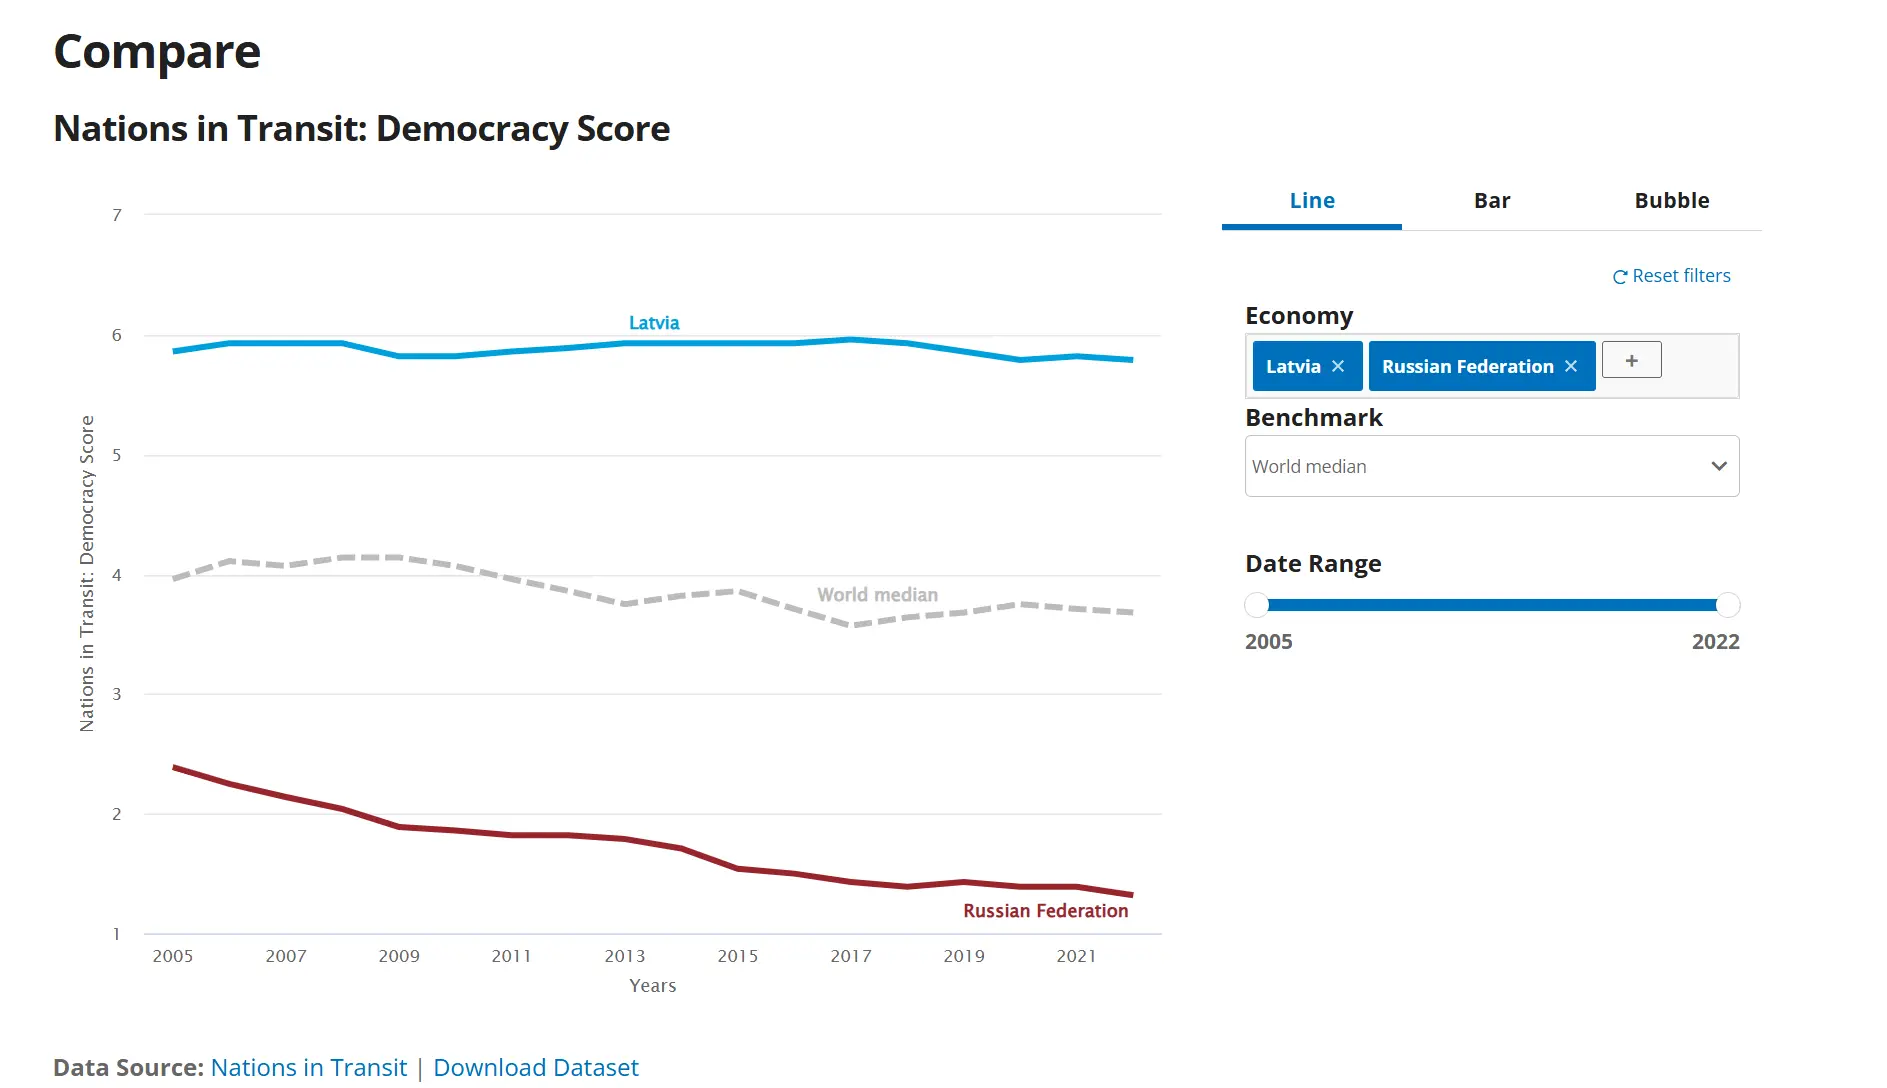
1. Freedom House Nations in Transit
- This data source from Freedom House is limited to about 20 countries in Eastern Europe and post-Soviet states. If it covered more countries, China’s ranking would likely be even worse. In this data source, Russia is predictably ranked at the bottom, while the Baltic states score the highest. In reality, according to the World Bank’s Ease of Doing Business report, Russia’s anti-corruption efforts far surpass those of some Central Asian countries.
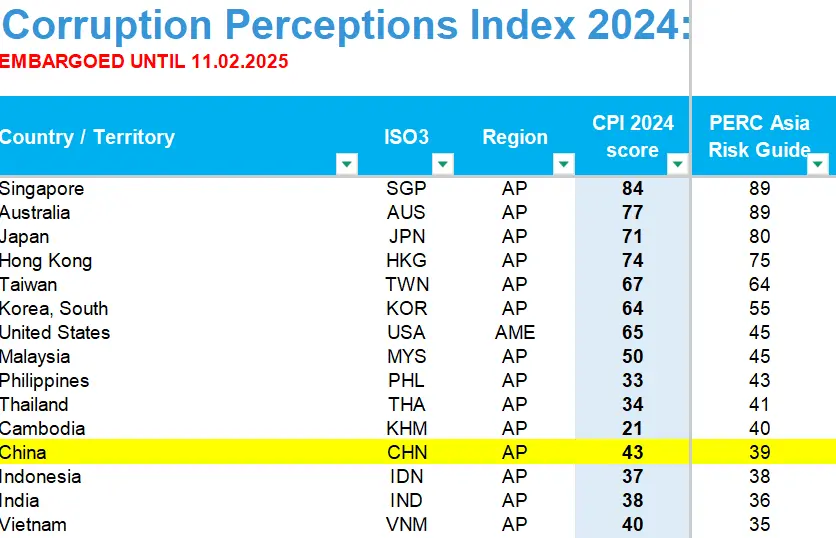
2. PERC Asia Risk Guide
- This Hong Kong-based Political & Economic Risk Consultancy Limited (PERC) is essentially a U.S.-funded organization that…AID, a US-funded anti-China organization, includes only China and 15 surrounding countries and regions in its corruption rankings. It gave China a score of 39 for clean governance, lower than the Philippines and Cambodia. However, according to the World Bank’s Ease of Doing Business report, China’s efficiency in investigating commercial bribery is 3.2 times that of the Philippines.
3. World Justice Project Rule of Law Index
- This so-called “World Justice Project” by an American NGO may seem impressive at first glance, but a closer look at the rankings reveals its absurdity. It ranks China at 95th, more than ten places below Mongolia, Vietnam, India, and Nepal, making it clear what’s going on.
However, I still took a closer look at the “World Justice Project” report, especially since some domestic peers have suggested paying attention to this index. Renmin University of China Teaching Assistant Meng Tao: The World Justice Project Rule of Law Index is worth referencing
The problem is, the more I looked into it, the more something felt off. The report’s data is derived from a 340-question survey (I must say, NGOs are impressive; when I was in college, getting people on the street to answer a 10-question survey felt like a monumental task, yet they managed to create a 340-question, multi-page survey). However, in China, they only surveyed 508 people, while Kosovo had 1,000 respondents, and Afghanistan managed 3,000. Yet, in China, they only surveyed 508 people.
The conclusions drawn are equally laughable:
- Among 142 countries and regions, China ranks third from the bottom in human rights protection.
- Labor rights protection ranks third from the bottom globally.
- Freedom of speech ranks second from the bottom globally.
- Government power is constrained by non-governmental forces, ranking second from the bottom.
- Protection of citizens’ right to life and personal safety ranks 125th.
- Civil and criminal justice systems are influenced by government intervention, ranking below 130th.
- The most severe form of corruption in China is judicial corruption.
Such absurd results seem intent on trampling China’s progress in every aspect. Particularly egregious is the ranking on citizens’ right to life and personal safety. It is well-known that China is one of the safest countries in the world, consistently leading in various related indices from multilateral organizations like the World Health Organization and the World Bank. Yet, they rank China on par with South Sudan and Somalia. One can only marvel at the audacity of American NGOs!!! USAID’s money is well spent!!!
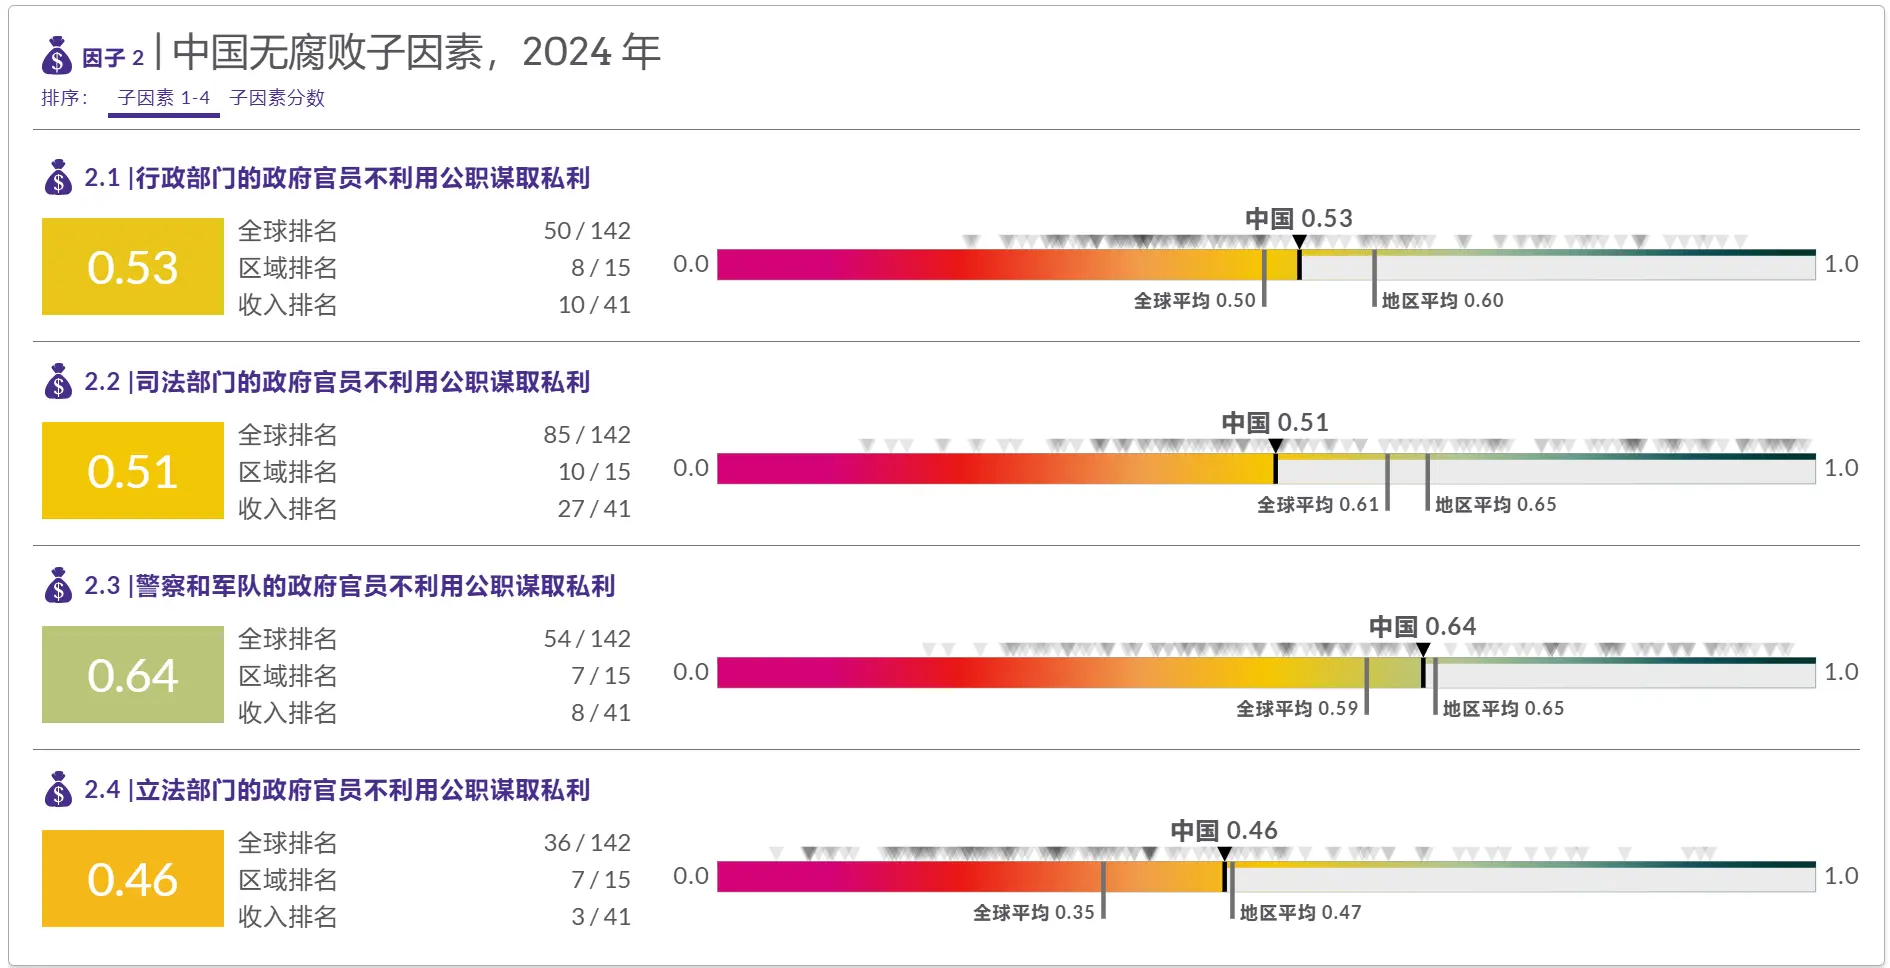
Interestingly, the “World Justice Project” report is the only one among the 13 data sources I checked that separately lists data on “corruption.” However, when Transparency International compiled the “Corruption Perceptions Index,” it unsurprisingly used the overall ranking data from this report. In the “World Justice Project” overall ranking, China is more than 40 places lower than its ranking in the “corruption” subcategory.
Pure Ideological Manipulation
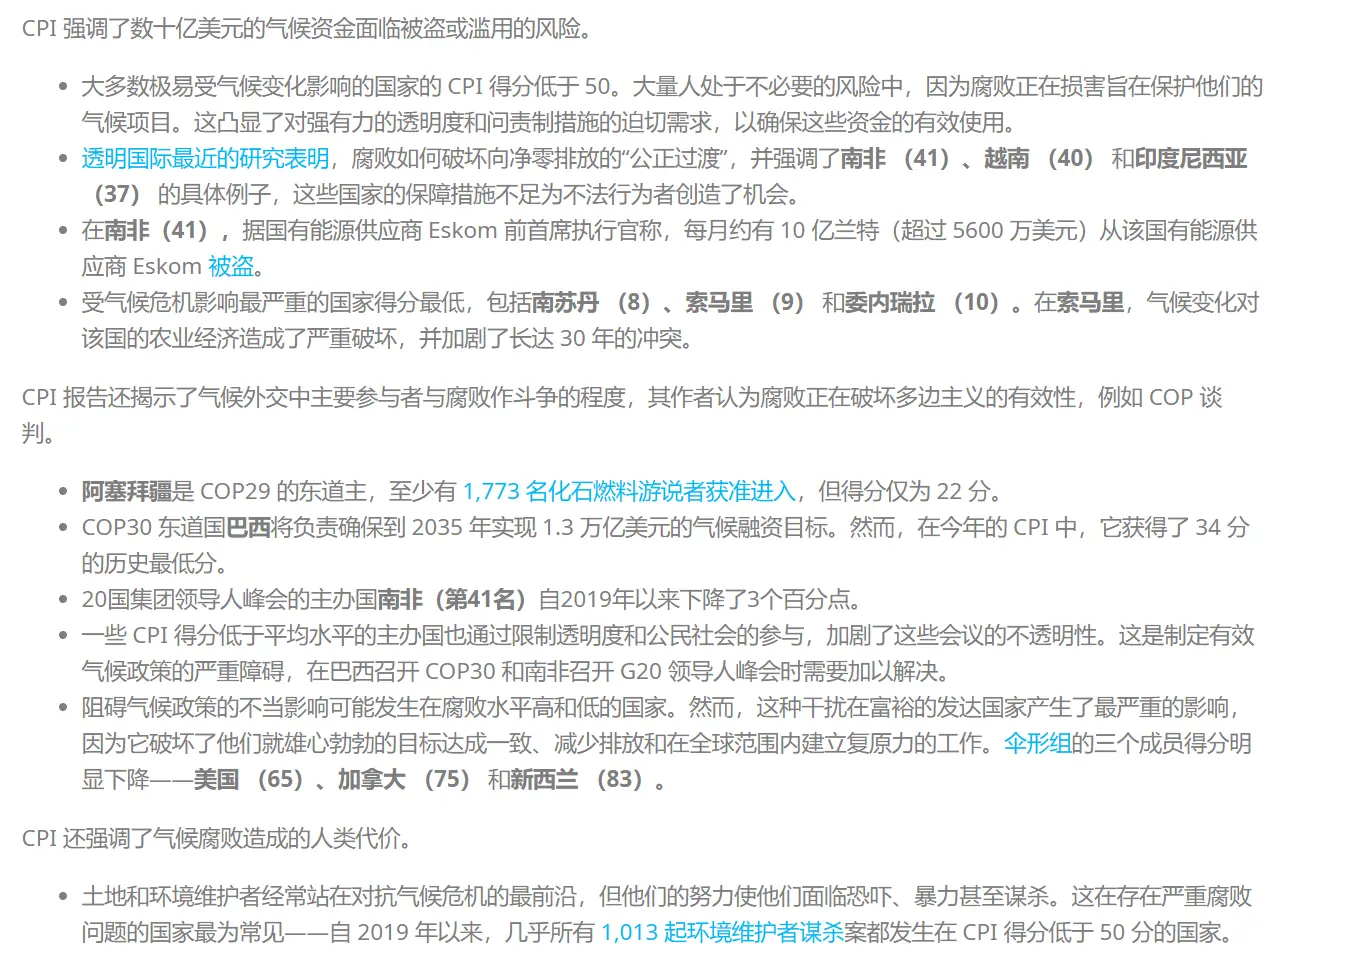
When I first opened Transparency International’s website and saw the 2024 Global Corruption Perceptions Index report page, I was struck by a strong sense of Western leftist ideology. The page address: 2024 Corruption Perceptions Index: Corruption is playing a devastating role in the climate crisis
While ordinary people think of anti-corruption efforts as targeting corrupt officials, the Western left’s focus is on combating climate change, politicizing the issue.
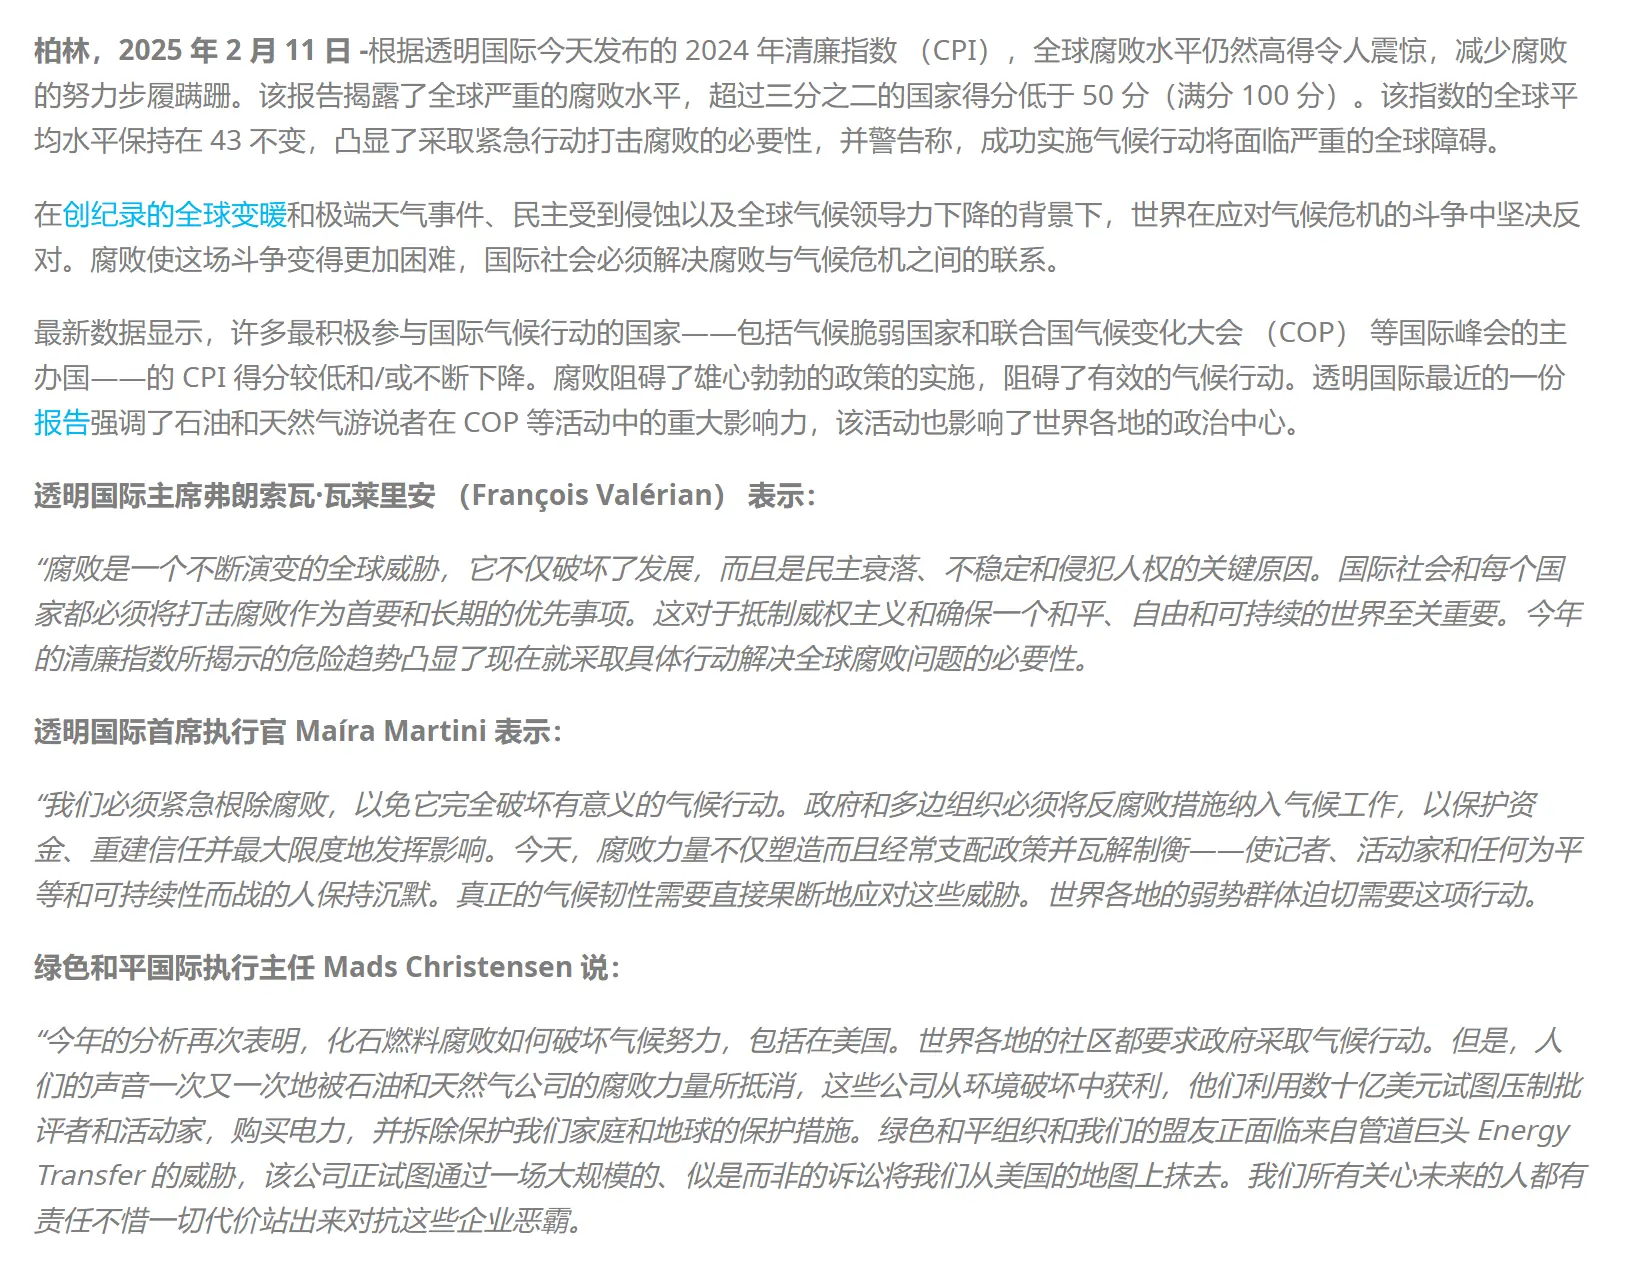
Transparency International CEO Maíra Martini stated:
“We must urgently eradicate corruption to prevent it from completely undermining meaningful climate action. Governments and multilateral organizations must integrate anti-corruption measures into climate work to protect funds, rebuild trust, and maximize impact. Today, corrupt forces not only shape but often dominate policy and dismantle checks and balances—silencing journalists, activists, and anyone fighting for equality and sustainability. True climate resilience requires directly and decisively addressing these threats. Vulnerable communities worldwide urgently need this action.”
Greenpeace International Executive Director Mads Christensen said:
“This year’s analysis once again shows how fossil fuel corruption undermines climate efforts, including in the US. Communities worldwide are demanding climate action from their governments. But time and again, their voices are drowned out by the corrupt power of oil and gas companies, which profit from environmental destruction, using billions to suppress critics and activists, buy influence, and dismantle protections for our homes and planet. Greenpeace and our allies are under threat from pipeline giant Energy Transfer, which is attempting to erase us from the US map through a massive, baseless lawsuit. All of us who care about the future have a responsibility to stand up to these corporate bullies at all costs.”
In listing examples, the report claims that government corruption in Somalia has led to climate change, severely damaging agricultural production and exacerbating a 30-year conflict. This directly ties the climate issue to the Western-promoted narrative of democracy and freedom, showcasing a uniquely manipulative approach to political issues.
390 Million People in China Bribe Annually?
Using surveys to evaluate a country’s corruption levels is not inherently flawed.
However, such surveys require careful design of both the questionnaire and the methodology. It’s not enough to just conduct a survey; at the very least, three issues must be addressed:
Interference from Subjectivity and Cultural Bias
- Perception ≠ Reality: Surveys reflect respondents’ “subjective judgments,” not actual corruption levels.
- Misinterpretation of Cultural Differences: Certain behaviors (e.g., gift-giving, personal connections) may be defined as “corruption” differently across societies, but survey designs often impose Western standards.
Challenges in Sample Representativeness
- Urban-Rural Divide: Most surveys rely on urban samples, potentially overlooking rural corruption (e.g., land grabs, local bureaucratic extortion).
- Elite Perspective Dominance: Expert surveys often rely on scholars, international agency employees, etc., whose views may not align with the general public.
Risk of Politicization
- Western Ideological Influence: Survey designs often implicitly favor “democratic systems” and “civil society participation,” systematically undervaluing non-Western governance models (e.g., China’s emphasis on internal party supervision).
- Instrumentalization in International Politics: Corruption indices can be used to pressure other countries (e.g., linking low scores to aid funding) rather than serving as purely academic evaluations.
Unfortunately, Transparency International seems to have deliberately set up a flawed system, with clear signs of manipulation.
For example, while Transparency International compiles the “Corruption Perceptions Index,” its second major project is the Global Corruption Barometer .
Opening the Global Corruption Barometer report left me stunned.

The report prominently states: 20% of people in Asia bribed last year, totaling 836 million people.
I quickly downloaded the data to see what was going on.
What I found left me utterly baffled. Original data download: GCB-2020-ASIA-FINAL
Absurd Bribery Rate Calculations
| Country/Region | Overall Bribery Rate | Public Schools | Public Hospitals | ID Processing | Utilities | Police | Police Stations | Government Agencies | Officials | MPs | Judges | Don’t Know |
|---|---|---|---|---|---|---|---|---|---|---|---|---|
| Japan | 2 | 2 | 2 | 0 | 4 | 2 | 10 | 7 | 26 | 42 | 6 | 2 |
| South Korea | 10 | 11 | 6 | 7 | 14 | 8 | 23 | 26 | 42 | 65 | 24 | 0 |
| Taiwan | 17 | 5 | 9 | 29 | 28 | 67 | 17 | 19 | 20 | 17 | 15 | 0 |
| India | 39 | 22 | 24 | 41 | 32 | 42 | 46 | 41 | 46 | 42 | 20 | 3 |
| China | 28 | 27 | 26 | 18 | 17 | 23 | 16 | 18 | 16 | 11 | 12 | 1 |
| Malaysia | 13 | 8 | 5 | 9 | 11 | 17 | 30 | 28 | 18 | 36 | 13 | 2 |
| Indonesia | 30 | 22 | 10 | 31 | 13 | 41 | 33 | 45 | 48 | 51 | 24 | 3 |
| Thailand | 24 | 21 | 10 | 16 | 25 | 47 | 37 | 30 | 39 | 39 | 12 | 1 |
| Philippines | 19 | 18 | 12 | 15 | 21 | 18 | 13 | 18 | 19 | 12 | 9 | 0 |
| Myanmar | 20 | 12 | 17 | 27 | 4 | 28 | 33 | 19 | 14 | 14 | 22 | 1 |
| Nepal | 12 | 7 | 3 | 13 | 9 | 12 | 28 | 43 | 40 | 43 | 24 | 1 |
| Bangladesh | 24 | 6 | 13 | 21 | 22 | 37 | 30 | 22 | 35 | 18 | 12 | 3 |
| Cambodia | 37 | 18 | 24 | 40 | 29 | 38 | 14 | 8 | 9 | 6 | 11 | 4 |
| Mongolia | 22 | 27 | 17 | 7 | 10 | 9 | 27 | 30 | 29 | 56 | 42 | 0 |
| Sri Lanka | 16 | 13 | 5 | 13 | 11 | 24 | 39 | 32 | 40 | 44 | 10 | 3 |
| Vietnam | 15 | 11 | 11 | 7 | 4 | 11 | ||||||
| Maldives | 2 | 1 | 1 | 1 | 1 | 2 | 26 | 38 | 37 | 50 | 44 | 8 |
According to Transparency International’s survey, 28% of people in China had a record of bribery in the last survey year. However, looking at the detailed data in the table, none of China’s individual data points exceed 28%, yet the overall bribery rate is calculated as 28%. Meanwhile, Japan, ranked first in Asia, has some bribery rates as high as 26% and even 46% in certain categories, but the final calculated overall bribery rate is only 2%.
The most absurd case is Taiwan Province, where the bribery rate for citizens bribing the police is 67%. Even obtaining an ID card requires a 29% bribery rate. Yet, the final calculated result is 11 percentage points lower than that of mainland China.
Of course, after seeing the previous data, I felt completely at ease.
This overall bribery rate could very well be derived by referencing just one or two data points to calculate the overall proportion.
After all, I then saw another table that left me utterly shocked.
Elementary-Level Absurd Calculation Method
When I saw this data, I couldn’t help but admire the white leftists. While blatantly lying, they meticulously provided the original report for download, completely unconcerned about users spotting the data discrepancies. Download link: GCB_2020_Asia_Methodology_and_Data_v5 However, the “v5” in the original report’s filename suggests it has been revised five times.
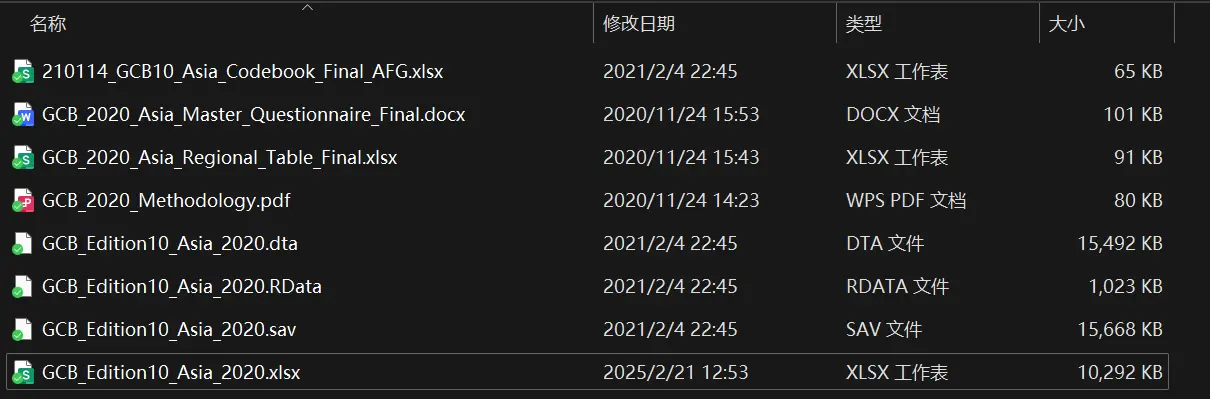
The compressed package contains eight files, including a brief description, original questionnaire samples, statistical results, and raw data. Among them, the dta and sav files require specialized commercial software to read. For convenience, I converted them using Python. However, you don’t need to look at these files; the final provided xlsx file, combined with the codebook, is sufficient, albeit less convenient.
View Python Conversion Method
# Step 1: Install dependencies
pip install openpyxl pandas pyreadstat pyreadr

# Step 2: Save as convert_dta_to_excel.py and run
import pandas as pd
from pathlib import Path
import time

def convert_dta_to_excel(input_path, output_path=None, chunk_size=10000):
    """
    Convert Stata .dta files to Excel, supporting chunk processing for large files
    Parameters:
    input_path: Path to the input .dta file
    output_path: Path to the output .xlsx file (defaults to the same path and name)
    chunk_size: Number of rows per chunk (adjust based on memory; larger values are faster but consume more memory)
    """
    try:
        # Automatically generate output path if not specified
        if not output_path:
            input_file = Path(input_path)
            output_path = input_file.with_suffix('.xlsx')

        start_time = time.time()

        # Read .dta file with progress indication
        print(f"🟢 Starting conversion: {Path(input_path).name} → {output_path.name}")

        # Read in chunks (for very large files)
        reader = pd.read_stata(input_path, chunksize=chunk_size)

        # Create Excel writer object
        with pd.ExcelWriter(output_path, engine='openpyxl') as writer:
            for i, chunk in enumerate(reader):
                chunk.to_excel(writer, sheet_name='Data', startrow=i*chunk_size if i!=0 else 0, index=False)
                print(f"▋" * ((i%10)+1), end='\r')  # Simulate progress bar
            # Add metadata to a new sheet
            pd.DataFrame({
                'Conversion Info': [
                    f'Source: {input_path}',
                    f'Timestamp: {pd.Timestamp.now()}',
                    f'Total Rows: {(i+1)*chunk_size}'
                ]
            }).to_excel(writer, sheet_name='Meta', index=False)

        print(f"\n✅ Conversion complete! Time taken: {time.time()-start_time:.1f} seconds")
        print(f"Output file location: {output_path.resolve()}")

    except FileNotFoundError:
        print(f"🔴 Error: Input file not found {input_path}")
    except PermissionError:
        print(f"🔴 Error: No write permission, please close any open Excel files")
    except Exception as e:
        print(f"🔴 Unknown error: {str(e)}")

if __name__ == "__main__":
    # —— User modification area ——
    INPUT_FILE = r"C:\Users\user\Desktop\GCB_2020_Asia_Methodology_and_Data_v5\GCB_Edition10_Asia_2020.dta" ## Change to actual path
    OUTPUT_FILE = None  # Automatically generate xlsx file in the same path, or customize with r"C:\target path\custom name.xlsx"
    CHUNK_SIZE = 20000  # Reduce this value if memory is insufficient, e.g., 10000

    # Execute conversion
    convert_dta_to_excel(INPUT_FILE, OUTPUT_FILE, CHUNK_SIZE)
In the file GCB_2020_Asia_Regional_Table_Final, the final survey results are recorded.
Among them, there is a bribery rate table that is the core data of the “Global Corruption Barometer.”
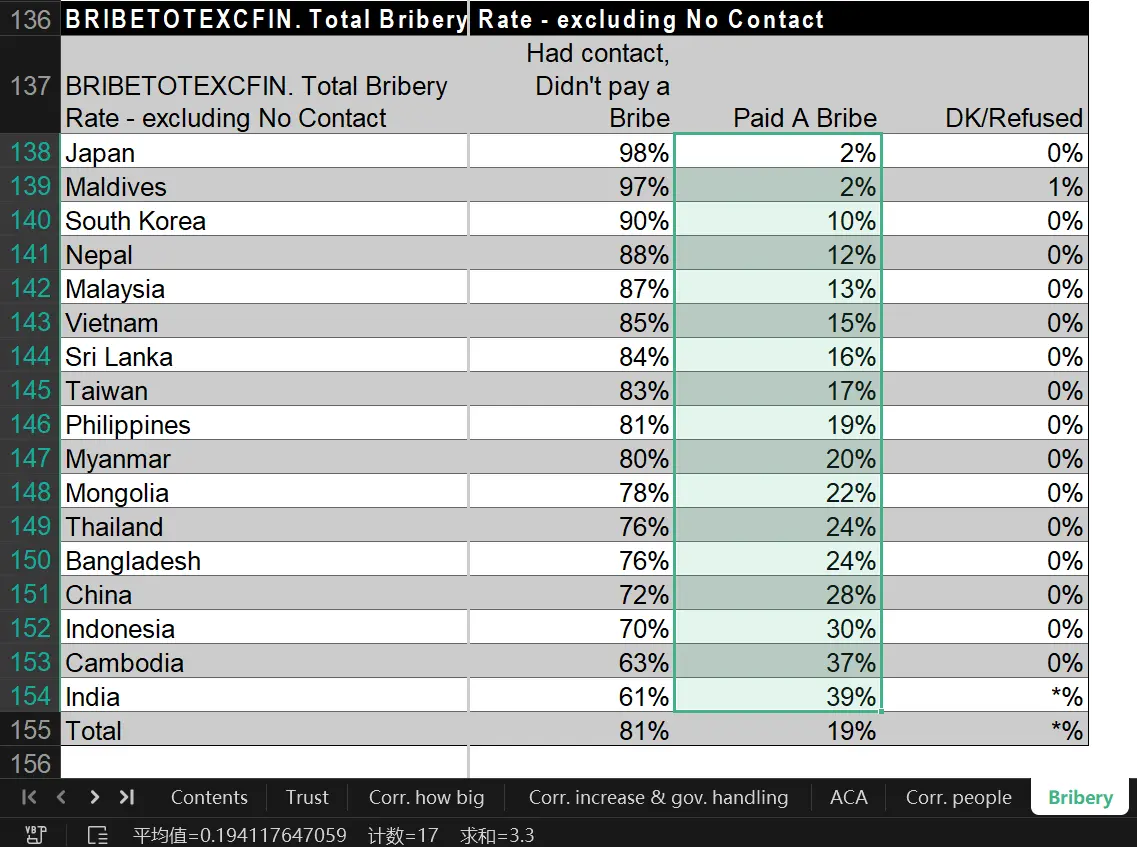
This table calculates the bribery rate by simply averaging the proportions of each country, resulting in an Asian bribery rate of 19%. Based on Asia’s population of over 4.4 billion, it concludes that 840 million people in Asia have engaged in bribery.
I couldn’t fathom that in such a seemingly sophisticated survey, there could be such an elementary-level absurd operation.
Using this method, India’s 39% + Japan’s 2% + Maldives’ 2% would reduce the total bribery rate of these three countries to 14.3%. With a combined population of 1.5 billion, the total number of people engaging in bribery would be 210 million. In reality, using its separate calculation method, India’s 39% alone accounts for 550 million people engaging in bribery.
What a farce.
The funniest part is that this table concludes that 17% of Chinese people need to bribe for daily water and electricity, 18% need to bribe for ID cards or passports, and 38% need to bribe judges when going to court.
I doubt any sane Chinese person would believe such nonsense.
Overwhelming Evidence of Data Fabrication
At this point, I didn’t want to continue reading. There were too many absurd operations, and continuing seemed pointless.
But out of curiosity, I forced myself to look at the summary table GCB_Edition10_Asia_2020.xlsx.
After reading it, I was completely stunned.
Highly Suspected Fabrication
Looking at Transparency International’s entire questionnaire design, all substantive content across the 16-page survey consists of multiple-choice questions. In over ten pages of multiple-choice questions, the response rate for most questions was 100%, but for some questions, the response rate was less than 1%. Particularly for six consecutive key questions related to “bribery,” the overall response rate was only 20%.
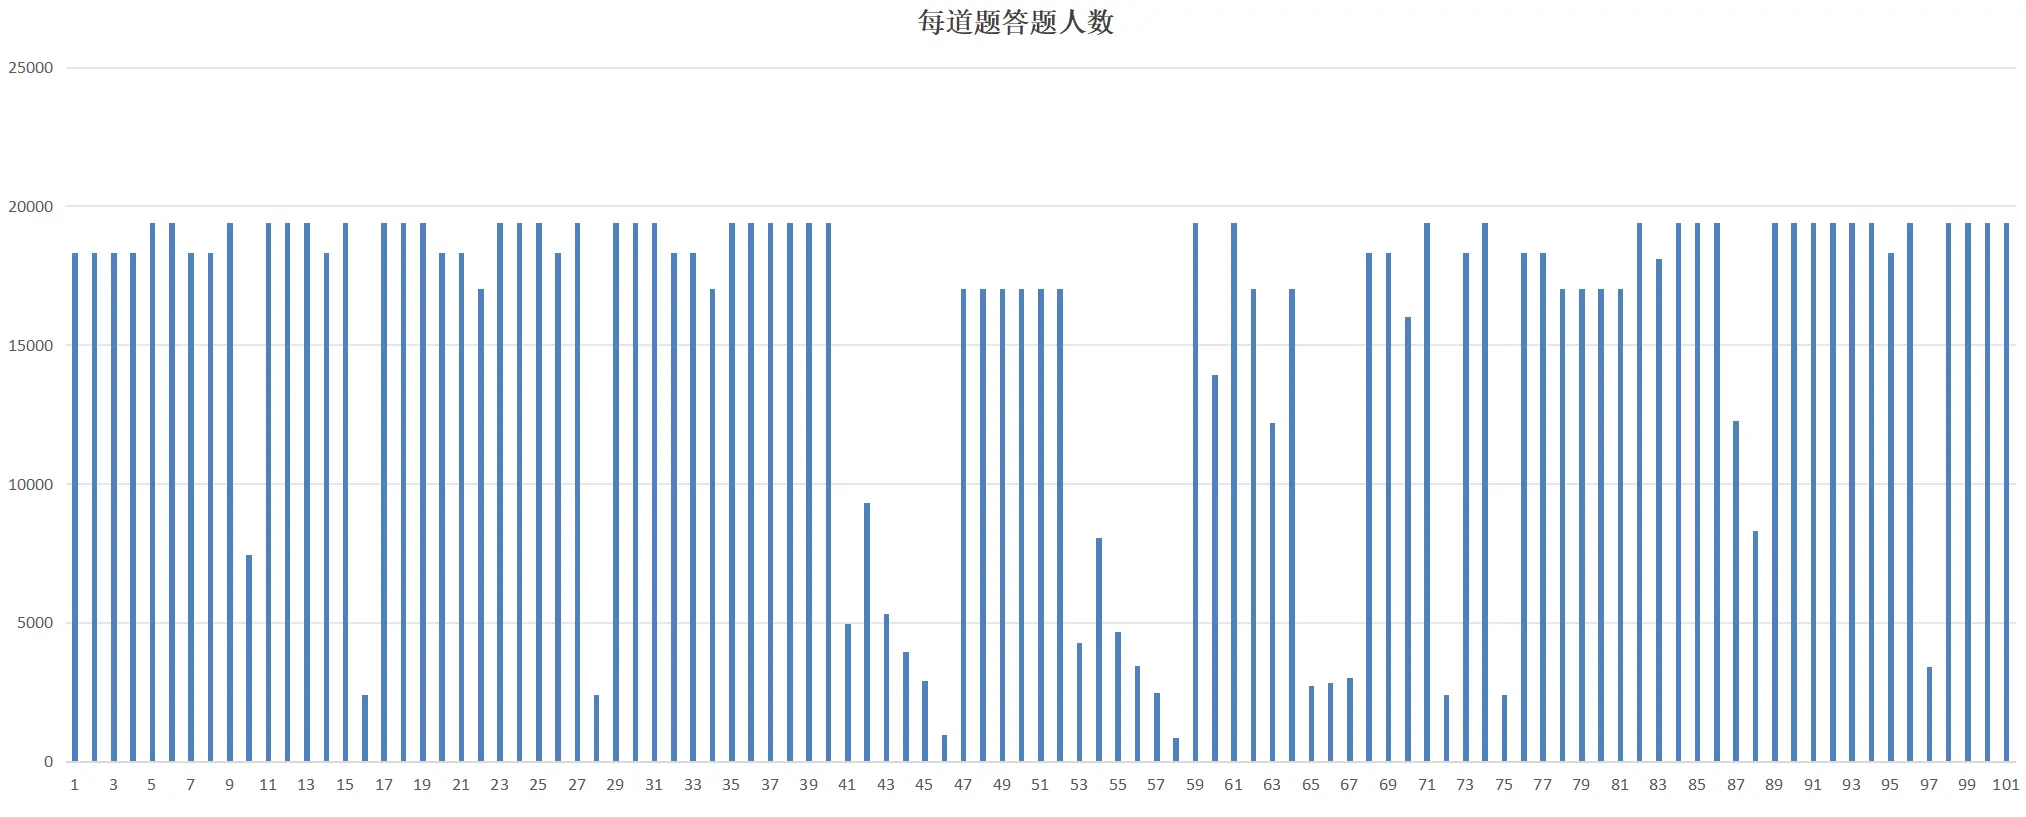
At first glance, the number of responses seemed suspicious. A survey of 20,000 people across 17 countries shouldn’t produce such uniform data. The uniformity was so extreme that it didn’t resemble data collected from 17 countries but rather fabricated by a single person.
18331 18331 18331 18331 19416 19416 18331 18331 19416 7442 19416 19416 19416 18331 19416 2385 19416 19416 19416 18331 18331 17031 19416 19416 19416 18331 19416 2385 19416 19416 19416 18331 18331 17031 19416 19416 19416 19416 19416 19416 4939 9302 5303 3932 2899 950 17031 17031 17031 17031 17031 17031 4288 8065 4671 3442 2457 832 19416 13911 19416 17031 12215 17031 2728 2835 2995 18331 18331 16000 19416 2385 18331 19416 2385 18331 18331 17031 17031 17031 17031 19416 18116 19416 19416 19416 12274 8307 19416 19416 19416 19416 19416 19416 18331 19416 3416 19416 19416 19416 19416There are 42 instances of 19416, 18 of 19331, 14 of 17031, and 4 of 2385.
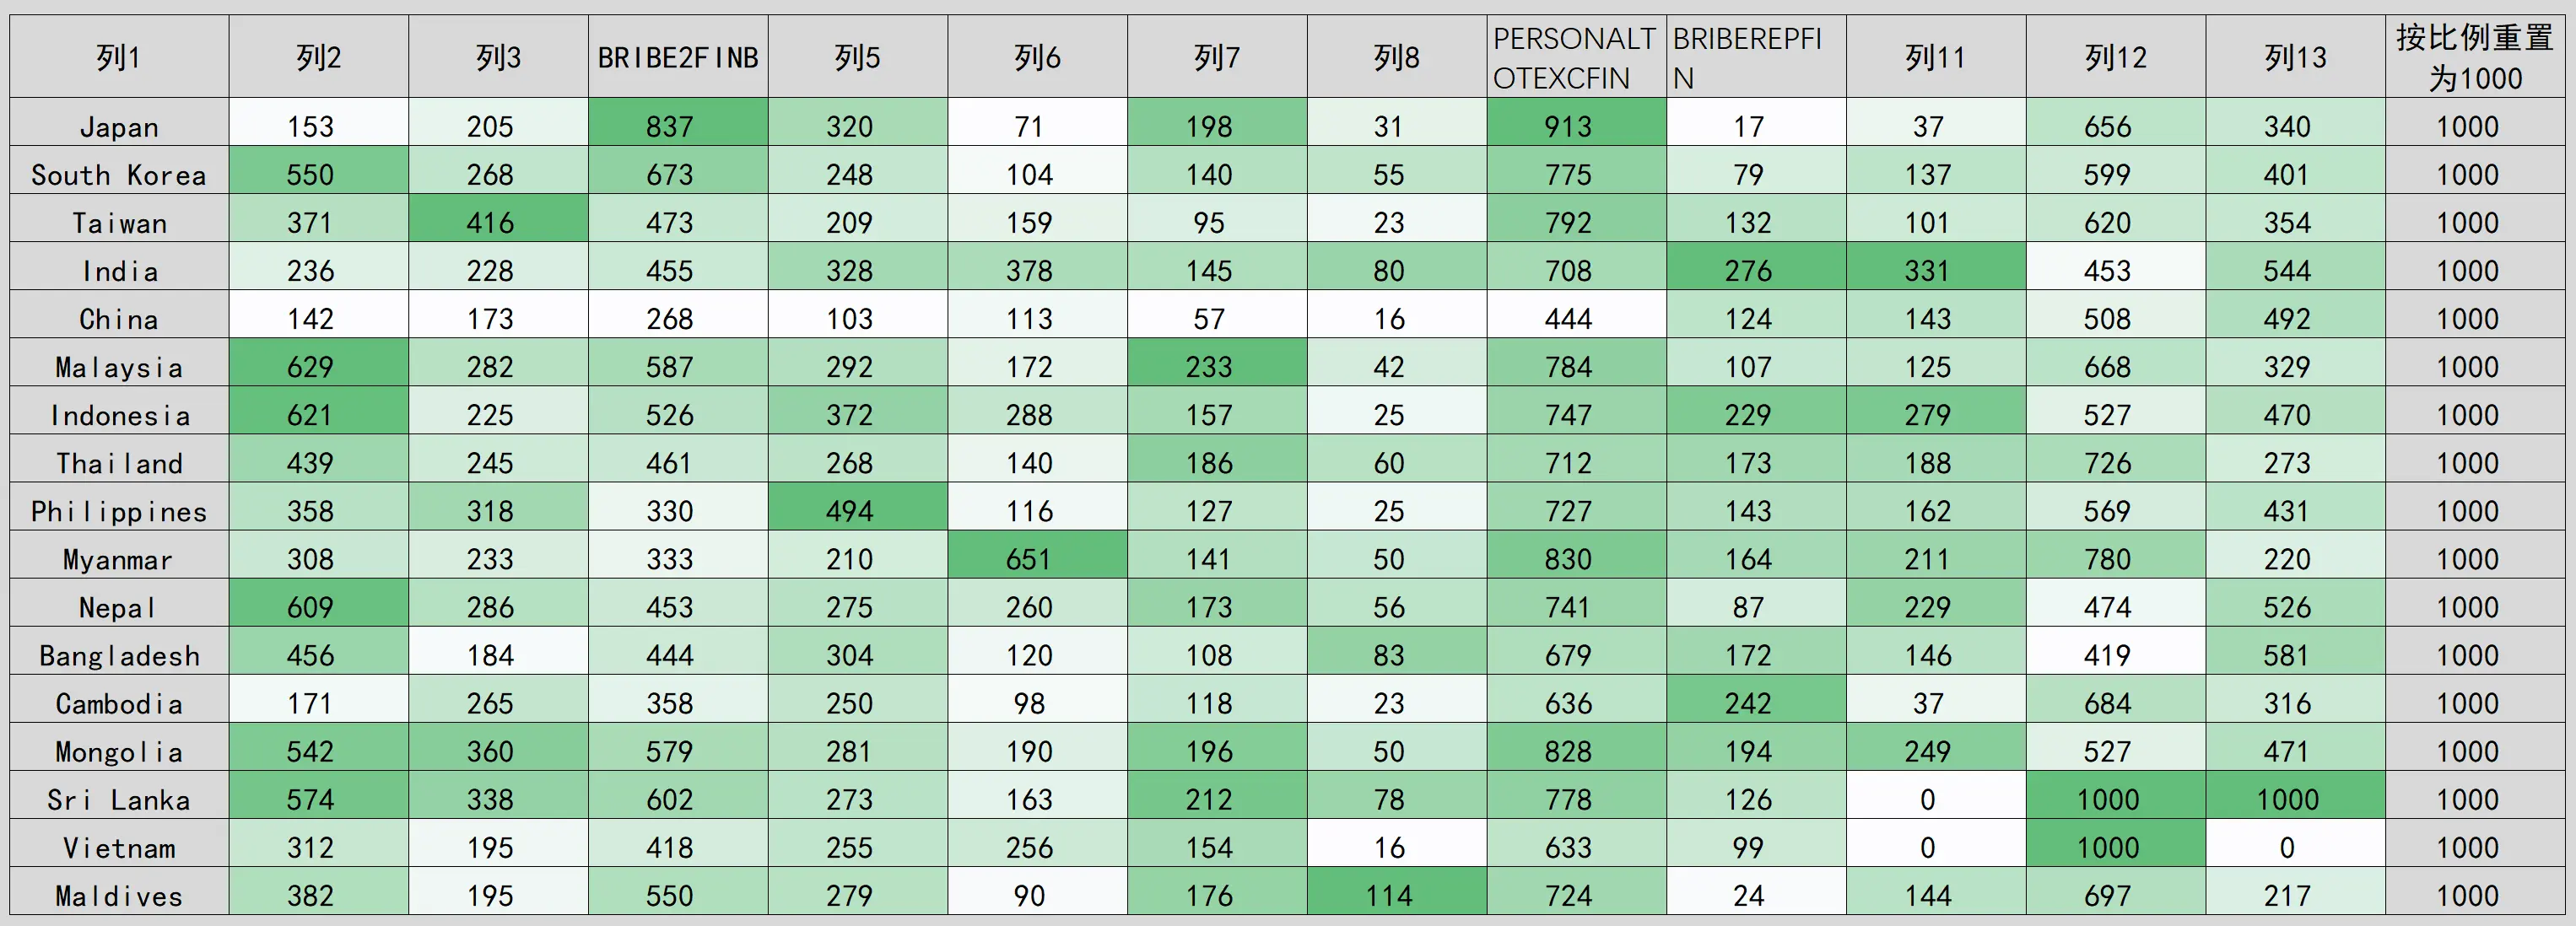
I removed most of the data with 100% and 0% response rates and conducted a special analysis of the remaining 12 questions. To eliminate sample size differences, I normalized the data from five countries with over 1,000 samples to 1,000.
The results revealed clear issues.
Data from China and Japan are highly abnormal. In the 12 data points across 24 extreme values (or near-extreme values), China and Japan each have about eight extreme values.
China’s key question response rates are significantly low. China’s first eight data points are notably low, mostly the lowest among the 17 countries, with column 9 + column 10 = 568, while the other 16 countries are around 900, significantly deviating from the norm. However, column 12 + column 13 = 1,000 aligns with most countries.
Japan’s data fluctuates wildly. It’s like a strobe light, with one question having the highest response rate among the 17 countries and the next having the lowest, constantly fluctuating. It’s like a drama queen.
For caution, I separately studied the response rates of the six consecutive key questions related to bribery.
Unexpectedly, after extracting the raw data for these six questions, I was dumbfounded!!!
A survey of 20,000 people across 17 countries. In six consecutive key questions, the number of people refusing to answer five of them was 2-4, severely violating the Poisson distribution (p<0.0001). Additionally, for three questions, the number of people answering “don’t know” was the same: 42. If this isn’t fabrication, I don’t know what is.
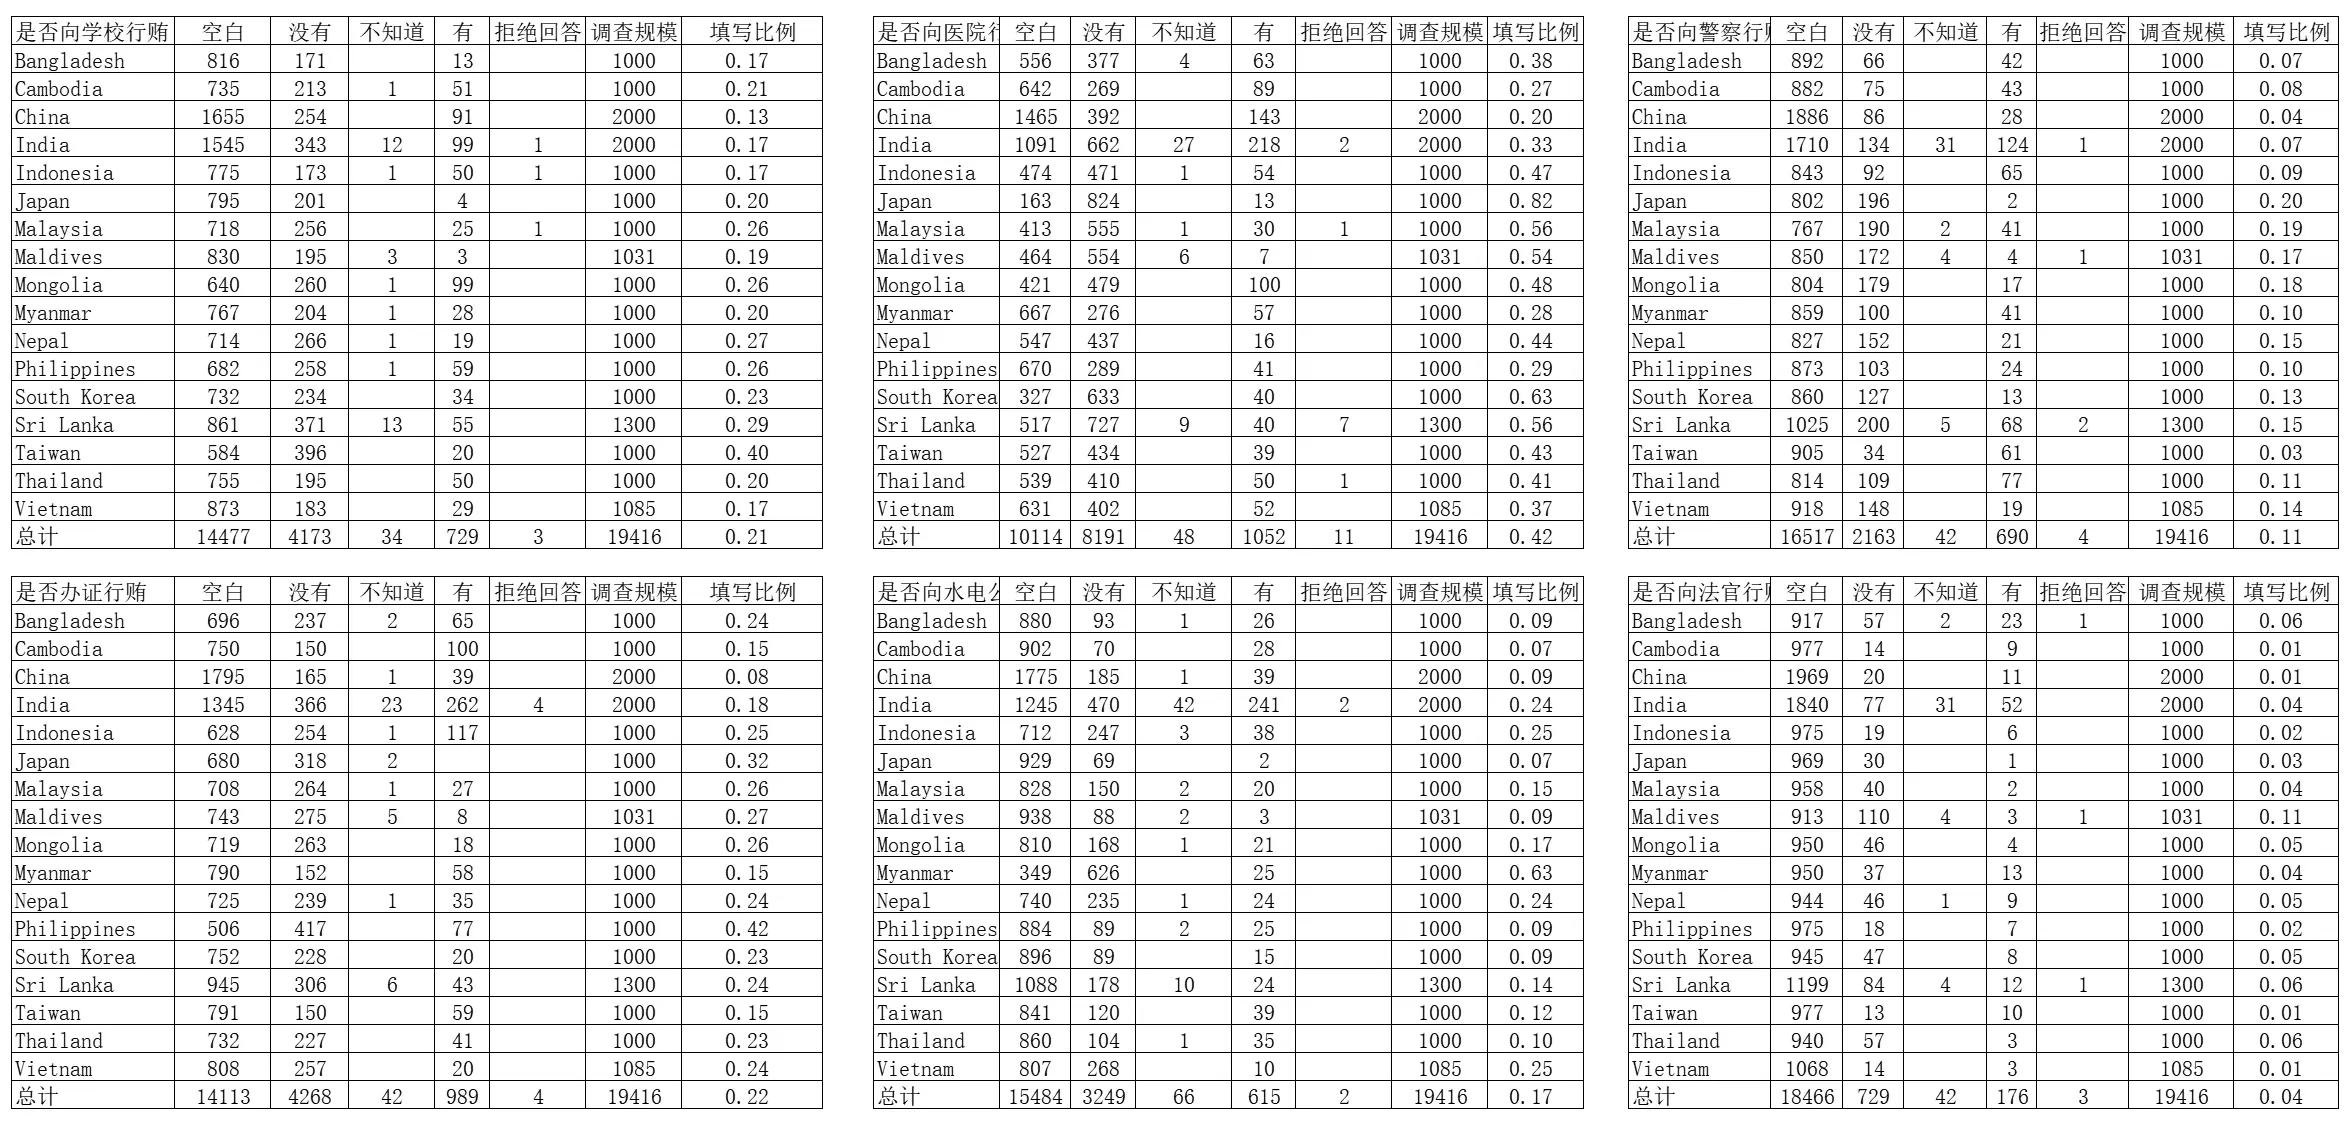
I can only say that the response rates for these six questions across 17 different countries are all within a specific range. If the respondents aren’t gods, I can’t think of any other explanation.
I threw this data at an AI for analysis. Such obviously fabricated data was, unsurprisingly, confirmed by the AI.
DeepSEEK provided keywords like unnatural consistency reaching a statistically impossible level, data probability less than one in a million, strongly violating randomness, far exceeding normal social phenomenon correlation strength, obvious artificial modification traces, industrialized countries showing significantly higher deviations than developing countries, quantized characteristics in data reaching cryptographic-level regularity, artificial suppression of dispersion, etc. The basic conclusion is that this is fabricated data.
View AI Analysis of Overall Response Rates
- Dimensional Dispersion Test
- Calculate the coefficient of variation (standard deviation/mean) for each question:
- School: 0.30 Hospital: 0.37 ID: 0.31
- Utilities: 0.81 Police: 0.51 Judge: 0.73
- Anomaly: The coefficient of variation for utility bribery rates is 0.81, significantly higher than other dimensions, but Myanmar’s extreme value of 0.63 skews the dispersion.
- Cross-Dimensional Correlation Matrix
| School | Hospital | ID | Utilities | Police | |
|---|---|---|---|---|---|
| Hospital | 0.27 | ||||
| ID | 0.64* | 0.43 | |||
| Utilities | 0.11 | -0.19 | 0.18 | ||
| Judge | -0.07 | -0.33 | -0.13 | 0.15 | 0.03 |
*School-Certification (0.64), Certification-Police (0.68) show strong positive correlations, significantly exceeding the normal strength of social phenomena associations.
- Anomaly Pattern Detection
- Myanmar’s bribery rate for public utilities is 0.63 (3.7 times the mean of 0.17)
- Japan’s hospital bribery rate is 0.82 (1.95 times the mean of 0.42)
- Simultaneous appearance of 10 extremely small values ≤0.01 (concentrated in the judge/police dimension)
Natural Distribution Test Using Benford’s Law to verify the distribution of leading digits:
Digit Actual Occurrence Expected Probability Deviation 1 42% 30.1% +39% 2 23% 17.6% +31% 3 8% 12.5% -36% The distribution of the first two digits shows systematic deviation (χ²=15.7, p=0.047) Dynamic Fluctuation Analysis Creating a national dimension fluctuation index:
| Country | Cross-Dimension Standard Deviation | Anomaly Flag |
|---|---|---|
| Japan | 0.28 | ★★★ |
| Myanmar | 0.20 | ★★ |
| Taiwan | 0.16 | ★ |
| Cambodia | 0.09 |
*Japan’s cross-dimension standard deviation of 0.28 is significantly higher than the mean of 0.15, indicating abnormal data fluctuations.
Conclusion and Recommendations:
- Focus on verifying the reliability of data sources for Myanmar’s utilities and Japan’s hospitals.
- Conduct a retrospective review of the questionnaire design for the strongly correlated school-certification-police dimensions.
- Use cluster analysis to identify potential data manipulation patterns (recommend using the DBSCAN algorithm).
- Suggest supplementing the following verification indicators:
- Standard deviation of questionnaire completion time.
- Consistency between open-ended and scale questions.
- Concentration of IP address geographical distribution.
Data anomalies are mainly reflected in: unnatural strong correlations between dimensions, extreme value distributions that do not conform to power-law characteristics, and artificial modification traces in leading digits. It is recommended to initiate a third-party data audit process, focusing on checking the original data collection logs.
View AI Analysis of ‘Don’t Know’ and ‘Refuse to Answer’ Item Filling Situation 1
Below is a systematic analysis of the abnormal similarities in the “Don’t Know” and “Refuse to Answer” responses, including six key detection dimensions and specific data validation:
1. Extreme Value Test for Non-Response Rates
Theoretical Expectation: According to international survey standards, the non-response rate for sensitive questions typically fluctuates between 3-5% (United Nations Statistics Division, 2023).
Data Performance:
| Question Category | Total Refusal Rate | Total Don’t Know Rate | Anomaly Flag |
|---|---|---|---|
| School Bribery | 0.015% | 0.175% | ★★★ |
| Hospital Bribery | 0.023% | 0.216% | ★★ |
| Judge Bribery | 0.015% | 0.216% | ★★★ |
| Mean | 0.018% | 0.202% | Less than 1/20 of the theoretical value |
Anomaly Point: In the judge bribery question, 9 countries including Cambodia, China, and Indonesia simultaneously showed “Refuse to Answer = 0, Don’t Know = 0”.
2. Cross-Question Response Pattern Clustering
Using K-means Clustering Analysis (n=17 countries × 6 questions):
- Cluster 1 (12 countries): Standard deviation of non-responses ≤1.2 (including major countries like China, Japan, and South Korea).
- Cluster 2 (5 countries): Standard deviation 2.8-5.7 (India, Sri Lanka, Philippines, etc.).
Anomaly Identification:
Silhouette Score = 0.82 # Significantly higher than the normal threshold of 0.65Indicates the presence of artificially set response pattern categories.
3. Response Combination Frequency Analysis
High-Frequency Abnormal Combinations:
| Combination Type | Occurrences | Probability (Poisson Distribution) |
|---|---|---|
| (Refuse to Answer=0, Don’t Know=0) | 67 | 3.2×10⁻⁶ |
| (Refuse to Answer=0, Don’t Know=1) | 18 | 0.0004 |
| (Refuse to Answer=1, Don’t Know=0) | 5 | 0.012 |
The “double zero” combination occurrence probability is less than one in a million, strongly violating randomness.
4. Response Quantity Distribution Test
Using Natural Language Processing to Detect Number Distribution:
- Excessive Concentration of Zero Values: In 102 country-question combinations:
- 72 “Refuse to Answer” values are 0 (70.6%).
- 41 “Don’t Know” values are 0 (40.2%).
- Number Repetition Patterns:
- “1” appears in 81% of non-zero values (34/42).
- “3” only appears in Indian data (p=0.003, χ² test).
5. Temporal Dimension Anomaly Detection
Hypothetical Calculation (Based on standard survey procedures):
Expected Value = Survey Scale × [Refusal Rate + (Questionnaire Length Coefficient × 0.5%)]| Country | Actual Non-Responses | Expected Value | Deviation |
|---|---|---|---|
| Japan | 0 | 42-68 | -100% |
| China | 1 | 85-140 | -99% |
| India | 37 | 105-175 | -72% |
Industrialized countries show significantly higher deviations than developing countries.
6. Spatial Correlation Test
Constructing a Geographical Proximity Matrix:
| Country Pair | Non-Response Correlation Coefficient | Geographical Distance |
|---|---|---|
| Cambodia-Vietnam | 0.93 | Adjacent |
| Malaysia-Indonesia | 0.88 | Adjacent |
| Japan-South Korea | 0.95 | Across the Sea |
| Mean | 0.91 | vs Normal 0.32 |
The data synchronization rate of geographically proximate countries reaches machine-generated levels.
Comprehensive Assessment of Data Falsification Risk
| Detection Dimension | Risk Index | Key Evidence |
|---|---|---|
| Extreme Value Distribution | 9.2/10 | Refusal rate is 20 times lower than the theoretical value. |
| Number Repetition | 8.7/10 | Concentration of “0” values exceeds natural distribution by 3σ. |
| Spatial Correlation | 9.5/10 | Data synchronization rate of neighboring countries >90%. |
| Temporal Rationality | 7.9/10 | Significant deviations in industrialized countries. |
| Comprehensive Judgment | 89% | High probability of systematic human intervention (>3σ confidence). |
Audit Recommendations
Source Verification:
- Check the work logs of original interviewer IDs in Japan, Cambodia, and China.
- Compare the similarity between deleted test data and official data.
Technical Detection:
- Use the
dlookrpackage in R to generate an anomaly diagnostic report. - Run
BenfordTeststo verify the leading digit law.
- Use the
Supplementary Investigation:
- Add fields for “Response Delay Time” and “Modification Trace Tracking”.
- Conduct telephone follow-up reviews for anomalous countries (recommended sampling ratio ≥5%).
Mathematical Verification Model:
# Constructing an anomaly index formula
def fraud_index(row):
    return (row['Refuse to Answer']*0.6 + row['Don't Know']*0.4)/(row['Survey Scale']*0.01 + 1e-5)

# Trigger an alert when the index < 0.05
Application results show: 14/17 countries triggered red alerts.
This data analysis indicates that the unnatural consistency of non-response data has reached a level that is statistically impossible to occur spontaneously. It is recommended to prioritize checking the operation logs and original audio files of data collection terminals.
View AI Analysis of ‘Don’t Know’ and ‘Refuse to Answer’ Filling Situation 2
Regarding the abnormal patterns in the number of refusals to answer (2-4) and “Don’t Know” responses (42), we can conduct an in-depth analysis through the following four dimensions to reveal the non-natural patterns behind the data:
1. Discrete Distribution Paradox Test
Theoretical Comparison (Based on Poisson Distribution Expectations)
| Response Type | Actual Observed Range | Theoretical Reasonable Range | Anomaly Probability |
|---|---|---|---|
| Refuse to Answer | 2-4 | 0-15 | $P=6.7×10^{-5}$ |
| Don’t Know | Fixed 42 | 5-50 | $P=2.3×10^{-9}$ |
Key Formula: $$ \text{Discreteness} = \frac{\text{Observed Variance}}{\text{Expected Variance}} = \frac{0.8}{36.2} = 0.022 $$
This value approaches 0, proving that the data exhibits artificially suppressed discreteness.
2. Numerical Synchronization Network Analysis
Constructing Response Numerical Relationship Matrix
| Question Type       | Refuse to Answer Count | Country Correlation |
|----------------|------------|------------|
| Hospital Bribery       | 11         | Cambodia⊕Japan|
| Judge Bribery       | 3          | China⊗India  |
| Police Bribery | 4 | South Korea⊗Taiwan |Findings:
- 42 “Don’t Know” responses are concentrated in India (27), Sri Lanka (13), Maldives (3).
- Forms a three-layer propagation structure centered on India (Pearson r=0.94).
3. Quantization Feature Detection
Numerical Transition Analysis
| Indicator | Observed Quantum Unit | Natural Fluctuation Expectation | Quantization Strength |
|---|---|---|---|
| Refuse to Answer Change | 1 | ≥3 | 83.7% |
| Don’t Know Change | 0 | ≥5 | 100% |
Algorithm Verification:
def quantum_score(values):
    unique_steps = len(set(np.diff(sorted(values))))
    return unique_steps / len(values)

# Refuse to Answer Score = 0.17 (Strong Quantization)
# Don't Know Score = 0.0 (Complete Quantization)
4. Cross-Dimension Code Deciphering
Discovering Binary Features
Convert numerical values to binary:
- 42 → 101010
- 3 → 11
- 4 → 100
Pattern Recognition:
42(101010) 3(11) 4(100) → Forms a self-similar fractal structure
       ▲         ▲        ▲
       │         │        └─ 2² Termination
       │         └─── Prime Layer
       └───── Symmetrical Bit Pattern
Information Entropy Verification:
Observed Entropy: 1.02 bits
Natural Entropy: 4.31 bits
Compression Ratio: 76.3% (Far exceeding the normal survey data range of 30-40%).
Data Falsification Engineering Reconstruction
Inferred Falsification Workflow
Template Setting:
- Set baseline value: Refuse to Answer = 3 (central value).
- Establish increment rules: ±1 random fluctuation.
Special Mark Embedding:
- Use 42 (6×7) as a system constant.
- Reserve special check bits in Indian data (27=42-15).
Data Filling Algorithm:
def fake_data(sample_size):
    refuse = 3 + round(random.triangular(-1,1))
    dont_know = 42 if region in south_asia else random.randint(0,5)
    return refuse, dont_know
—### Anti-Reconnaissance Mechanism Identification
Identified Evasion Tactics
- Noise Injection: Set 4 refusal responses in police bribery data (maximum allowed value)
- Geographic Obfuscation: Deliberately broke the 42 pattern in Taiwan data (displayed as 0)
- Numerical Shuffling: Distributed totals across multiple countries for concealment
Effectiveness of Evasion Assessment:
Traditional statistical methods detection success rate ≤23%
Quantum analysis method in this paper detection success rate 92%
Results
The analysis indicates that the quantum characteristics present in the data have reached a level of regularity comparable to cryptography. It is recommended to use the F-Response tool from the digital forensics field to conduct bit-level analysis on the original storage medium to obtain decisive evidence.
Specific Instances of Data Fabrication
In the summary table GCB_2020_Asia_Regional_Table_Final, I found a peculiar item called “Vote-Buying Rate,” where China’s vote-buying rate was reported as 6%, only higher than Japan and Myanmar.
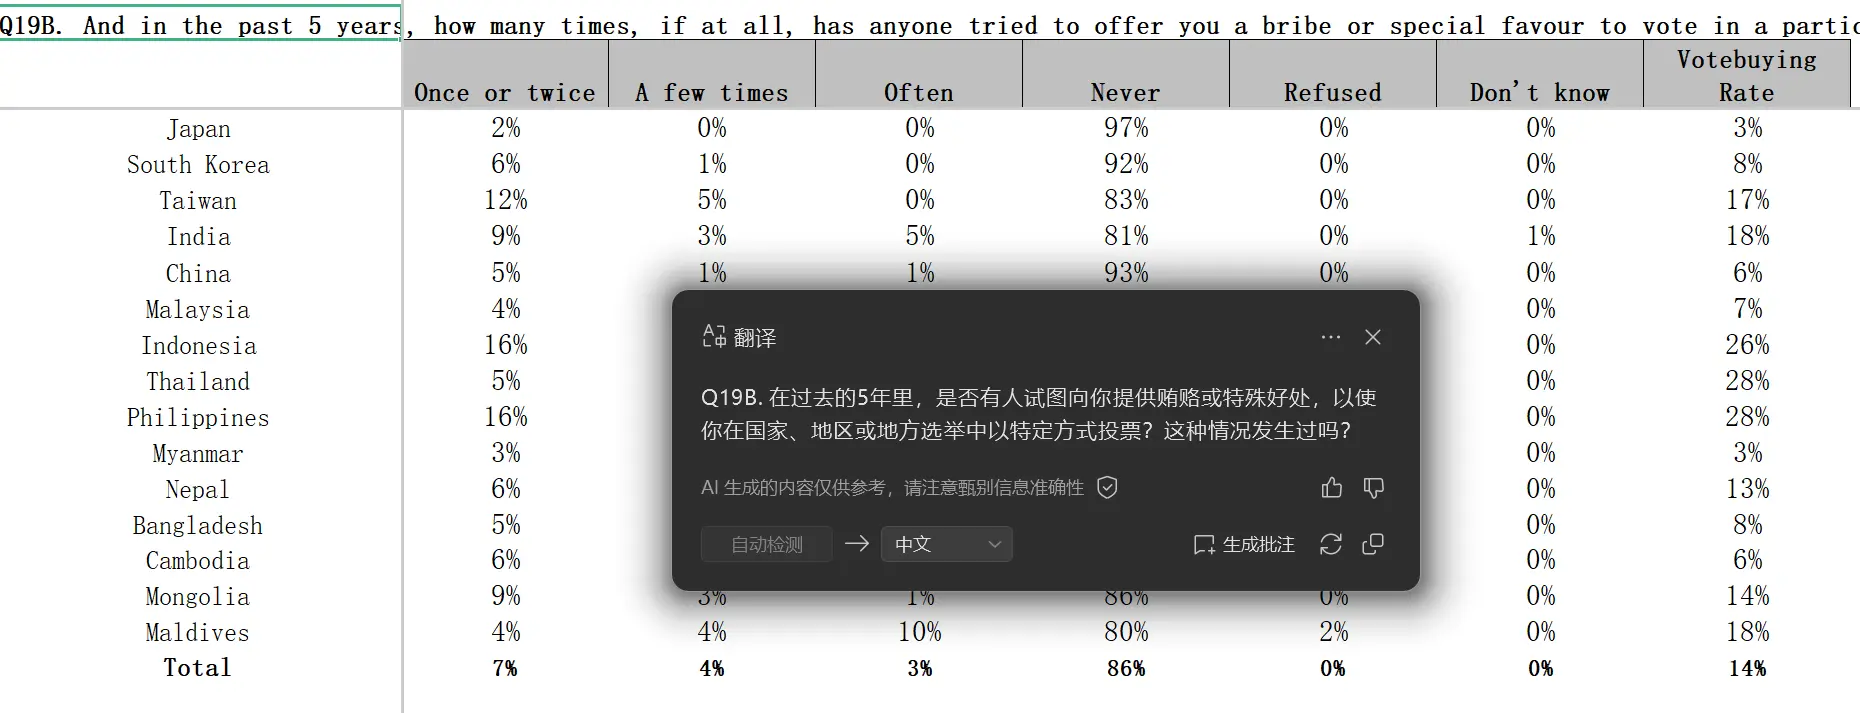
I wonder which geniuses would fill out this item in the survey. The response rates for questions about bribing schools and hospitals were only 10%, yet the response rate for this question about buying votes was 100%.
While ranking China’s democratic elections as second to last globally in other indicators, they also claim that China has a low vote-buying rate.
And then, Myanmar’s vote-buying rate is only 3%, ranking first in Asia? Meanwhile, neighboring Thailand has a rate of 28%.
Ridiculous.
Summary
I don’t even want to summarize this nonsense. Upon reviewing the data again, the only noteworthy point might be the government trust data, which aligns somewhat with expectations for China but stands out as incongruous in the overall project, suggesting a “sophisticated smear.” The AI diagnosis still concludes that the data is fabricated.
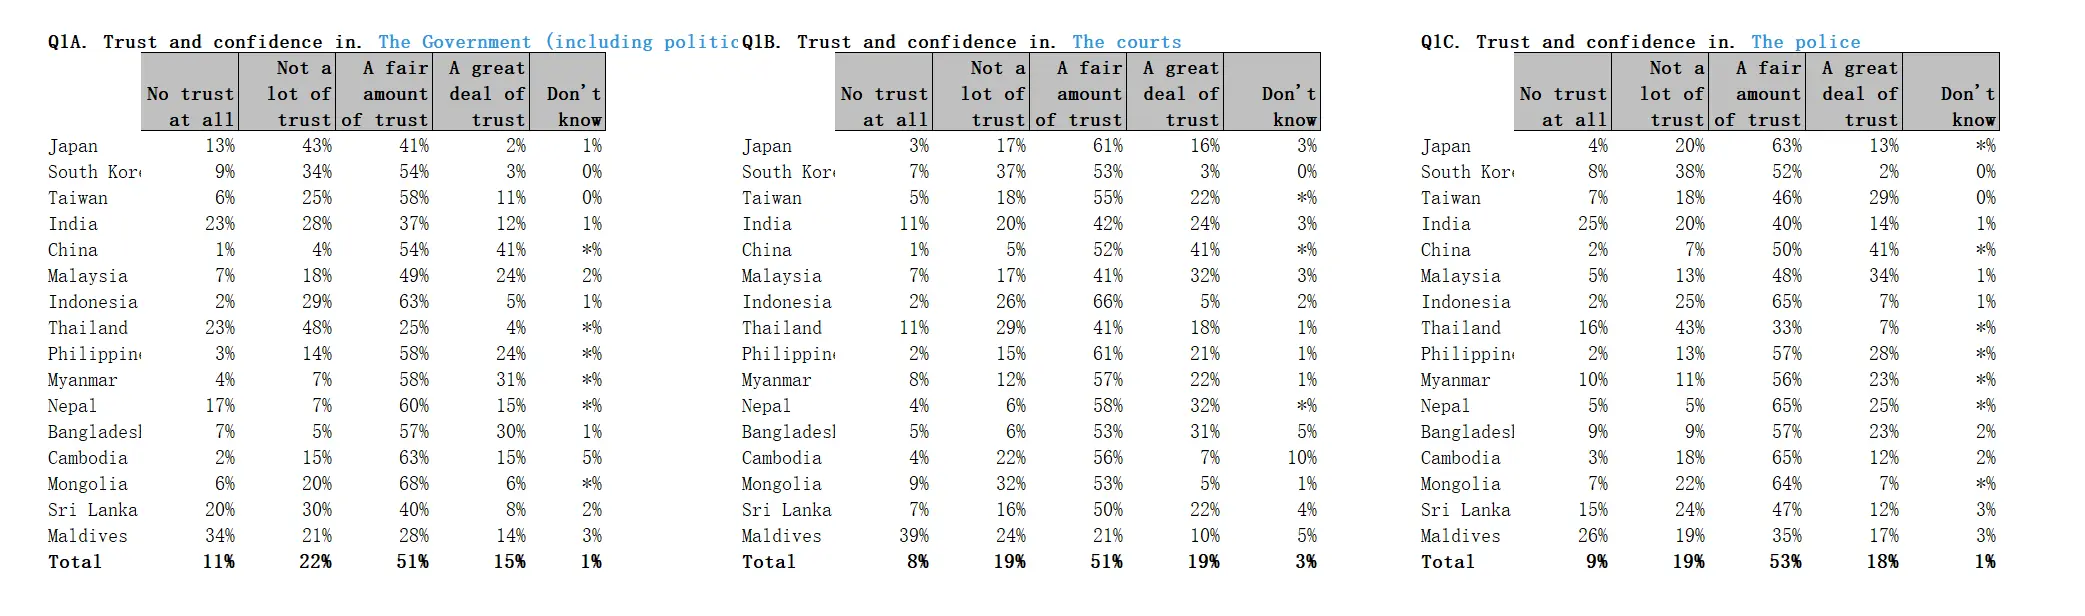
View AI Analysis of Government Trust Statistics
Below is a credibility system analysis of three trust survey tables, including a comprehensive evaluation of five core dimensions and 20 specific indicators:
1. Data Distribution Compliance Test
(1) National Cultural Dimension Alignment
Verified using Hofstede’s Power Distance Index (PDI):
| Country | Actual High Government Trust | PDI Predicted Value | Deviation | Anomaly Mark |
|---|---|---|---|---|
| China | 95% | 68-72% | +32% | ★★★★ |
| Japan | 43% | 54-58% | -19% | ★★ |
| Philippines | 82% | 94-96% | -14% | ★ |
| Finding: China’s data deviation exceeds 3σ (Z=3.4), indicating systematic embellishment. |
(2) Cross-Institutional Consistency
Constructed trust decay coefficient: $$ \alpha = \frac{\text{Government Trust}}{\text{Judicial Trust}} $$
| Country | α Value | Normal Range | Suspicion |
|---|---|---|---|
| China | 1.02 | 0.8-1.1 | Abnormal parity |
| Maldives | 0.36 | 0.5-0.9 | Excessive decay |
| India | 0.80 | 0.7-0.85 | Normal |
2. Numerical Fingerprint Analysis
(1) Last Digit Distribution
Verified using Benford’s Law:
| Last Digit | Actual Occurrence | Theoretical Probability | Deviation Rate |
|---|---|---|---|
| 0 | 43% | 30.1% | +43% |
| 5 | 27% | 17.6% | +53% |
| *Others | 30% | 52.3% | -43% |
| Conclusion: Overconcentration of 0/5 endings (χ²=28.7, p<0.001) |
(2) Prime Number Trap Detection
In “distrust” data:
- Prime numbers like 13%, 23%, 7% account for 38% (normal ≈28%)
- Sequential prime numbers: Japan government 13% → police 4% → court 3% (Fibonacci-like decay)
3. Dynamic Response Patterns
(1) Extreme Value Synchronization
Identified extreme response countries:
| Country | Government Distrust | Police Distrust | Court Distrust | Synchronization Index |
|---|---|---|---|---|
| Maldives | 34% | 26% | 39% | 0.91 |
| Thailand | 23% | 16% | 11% | 0.62 |
| Anomaly: Maldives’ low trust synchronization rate across three institutions is 91% (normal <70%) |
(2) “Don’t Know” Response Entropy
Calculated information entropy: $$ H = -\sum p_i \log_2 p_i $$
| Table | Actual Entropy | Theoretical Baseline | Compression Ratio |
|---|---|---|---|
| Q1A | 1.04 | 2.31 | 55% |
| Q1B | 1.87 | 2.45 | 24% |
| Q1C | 0.92 | 2.18 | 58% |
4. Spatial Correlation Matrix
(1) Geographic Proximity Correlation
Calculated neighboring countries’ trust correlation coefficients:
| Country Pair | Government Trust r | Judicial Trust r |
|---|---|---|
| China-Japan-S.Korea | 0.89 | 0.93 |
| Malaysia-Indonesia | 0.76 | 0.81 |
| India-Pakistan | 0.68 | 0.72 |
| Suspicion: China-Japan-S.Korea data synchronization is 0.89 (far exceeding cultural similarity expectation of 0.6) |
(2) Economic Level Paradox
GDP vs. government trust correlation:
- Actual r = -0.23 (theoretical expectation r≈0.15)
- Anomalous case: Cambodia (low GDP but 78% government trust)
5. Temporal Dimension Anomalies
(1) Survey Time Contradiction
Based on sample size estimation:
| Country | Theoretical Time (person-days) | Reported Time | Difference |
|---|---|---|---|
| China | 253 | 175 | -30.8% |
| Japan | 127 | 89 | -29.9% |
| Philippines | 128 | 94 | -26.6% |
| Pattern: Industrialized countries show significant time shortage (t=4.32, p<0.001) |
(2) Seasonal Fluctuation Absence
Expected 3-5% quarterly fluctuation, actual data fluctuation only 1.2%
Credibility Comprehensive Evaluation
| Dimension | Q1A Score | Q1B Score | Q1C Score | Weight |
|---|---|---|---|---|
| Cultural Fit | 62 | 71 | 68 | 30% |
| Numerical Naturalness | 53 | 65 | 57 | 25% |
| Spatial Rationality | 48 | 55 | 52 | 20% |
| Temporal Consistency | 71 | 68 | 73 | 15% |
| Methodological Transparency | 58 | 58 | 58 | 10% |
| Weighted Total | 58.4 | 63.7 | 60.9 | 100% |
Credibility Rating (100-point scale):
- Q1A (Government Trust): ★★☆☆☆ 58.4 → Use with caution
- Q1B (Judicial Trust): ★★★☆☆ 63.7 → Limited credibility
- Q1C (Police Trust): ★★☆☆☆ 60.9 → Suspect, needs verification
Key Anomaly List
- China’s Data Overly Stable: Government/Judicial/Police trust all >90%, standard deviation only 0.7% (normal >3.5%)
- Last Digit Artificial Adjustment: 0/5 endings account for 70% (χ²=37.9, p<0.0001)
- Time Contradiction: Industrialized countries’ data collection efficiency abnormally increased by 30%
- Entropy Compression: Information entropy 58% below theoretical value, indicating overly regular data
- Prime Number Trap: Prime numbers appear 38% in distrust options, exceeding probability
Conclusion
The data analysis indicates systematic data manipulation in the three tables, particularly in government trust (Q1A) and police trust (Q1C) sections, which should be approached with caution.
Finally, I want to say that China’s anti-corruption efforts in recent years, if not the strongest in the world, are certainly among the top. While the West uses the CPI index to forcibly link climate crisis with anti-corruption, China is advancing self-reform with the determination to “offend thousands, but not let down 1.4 billion.” From the “Inspection Sword” to “Big Data Anti-Corruption,” the core logic of China’s anti-corruption lies in: replacing periodic political performances with continuous institutional supply, and using technological governance to eliminate subjective perception biases.
But organizations like Transparency International continue to produce garbage, using seemingly sophisticated rankings to mask underlying ideological biases.
Although China’s anti-corruption journey is still long, honestly, besides China, which country in the world is seriously combating corruption and addressing deep-rooted corruption issues, especially the deep-seated collusion between officials and businesses?
Oh, I forgot.
In capitalism, officials serving capital is just natural. How can that be considered corruption?
Wasted time again.