
Yesterday, an epic “earthquake” hit the server enthusiast community. Nezha Probe, a widely used open-source server monitoring tool (probe), suddenly had a serious vulnerability exposed. Within hours, familiar avatars in various tech forums were crying out in despair.

Some users had hundreds of servers hacked overnight, all used by attackers for “cryptocurrency mining”; others had their server backend applications breached, forcing a complete rebuild of all business data; some even had their hosting services suspended by their providers due to abuse by attackers.
Looking at these dense clusters of tragedies, I sat in front of my computer, shivers running down my spine. Although I was lucky not to be affected immediately, I promptly shut down the probe service on my own machines.
The service was down, but a very real problem lay ahead.
Undoubtedly, server probes offer great convenience for individuals managing multiple servers. Precisely for this reason, applications like Nezha Probe have long evolved beyond a simple probe panel into behemoths integrating remote control, batch script execution, and even terminal management. However, common sense in security tells us that more code and more complex functionality mean more potential vulnerabilities. Once the panel’s master controller is compromised, all monitored client servers will fall like dominoes, instantly lost.
After shutting down Nezha, I stared at my five servers spread across different countries and fell into deep thought. Without monitoring, I couldn’t possibly log into each one daily to type commands and check. But I absolutely dared not use any third-party tools with remote control capabilities again.
I needed a pure, minimalist monitoring page that only passively reports data and leaves absolutely no backdoors for control. Since I couldn’t find anything fully reassuring on the market, I decided to build my own.
Although my coding experience is limited to tweaking config files, making me nearly a programming novice, I decided to pin all my hopes for this self-rescue on free, web-based AI. The result was surprisingly smooth; in less than an hour, I had launched a completely personalized monitoring system that belonged entirely to me.
Below, I’d like to share, in the simplest layman’s terms, how I directed AI to be my top-tier free worker, building this security line with just words, not code.
Step 1: Clarify the Architecture with AI First
Many people, when opening AI, immediately ask it to write server monitoring code. Trust me, that’s the beginning of endless errors and debugging. AI is like a highly skilled programmer without a grand vision; you must first set clear rules and boundaries for it.
This is how I started the conversation. I opened the currently popular Deepseek web version and began by saying: I have five Linux servers that need to automatically report hardware usage and network latency every thirty seconds. My hard requirements are extreme minimalism: no login features, no remote control, and absolutely no backdoors for hackers. Also, my servers are minimally installed, and I don’t want to install any bulky, heavy software. Can you help me design the most worry-free, lightweight solution?
Deepseek didn’t immediately throw a bunch of incomprehensible code at me. Instead, following my constraints, it combined a set of very practical, lightweight solutions.
On the client side (the monitored servers), it refused any complex languages and used the system’s built-in Shell scripts. It grabs data every thirty seconds, does its job, and exits, consuming no memory—truly zero-dependency.
On the server side (the central server receiving data), it used the most basic PHP files, requiring only a web environment to run. For data storage, it ditched heavy databases in favor of a single-file SQLite, which is like a portable, no-install version of Excel—just toss data in and it’s done. Finally, for the frontend display, it directly incorporated a free Chart.js library to automatically draw network fluctuations into nice-looking line charts.
Because I set clear resource and boundary limits from the start, the subsequent development went incredibly smoothly.
Step 2: Nitpick the AI Like a Product Manager
Throughout the implementation process, I didn’t even open a professional code editor. All I did was use my mouse, copying and pasting in the web chat window. Whenever I encountered abnormal data or unattractive page layouts, I never changed the code myself. Instead, I described what I saw to Deepseek and had it make the modifications.
For example, after running the first version of the script, the CPU usage on the webpage would often inexplicably spike to 100%. I directly questioned Deepseek: “Another machine is clearly idle, so why does the monitoring always show 100%?” Deepseek immediately explained that the previous top command captured instantaneous values, which are prone to misjudgment, and suggested using the vmstat command to capture averages over a period. I replied, “Sure, go ahead and change it,” and after replacing it, the curve flattened out perfectly.
Another example: the network latency graph often had many broken gaps. I asked Deepseek why the lines were disconnected. Deepseek analyzed and told me it might be because a single test happened to encounter occasional packet loss, resulting in empty data. It suggested sending two packets at once and averaging the results, which would take about two seconds longer but make the chart smoother. I said, “No problem, rewrite it immediately.” After redeployment, the gaps disappeared completely.
Throughout this high-frequency iteration process, you don’t need to understand the technical principles at all. You just need to look at the results, point out flaws, let the AI provide multiple-choice options, and you make the decisions.
Step 3: Use Multiple AIs for Code Auditing and Hardening
Still shaken by the previous vulnerability, once the functionality was working, I immediately used several AIs to conduct security audits on the current code.
Of course, ChatGPT started by saying that my project handles completely worthless data—all CPU usage, memory usage, network latency, etc.—which are typical low-value targets. Compared to targets with built-in WebSSH permissions and bidirectional long connections like Nezha Probe, this is totally unnecessary and difficult to attack. At most, vulnerabilities in the master controller itself could cause issues, but they couldn’t propagate to other servers.
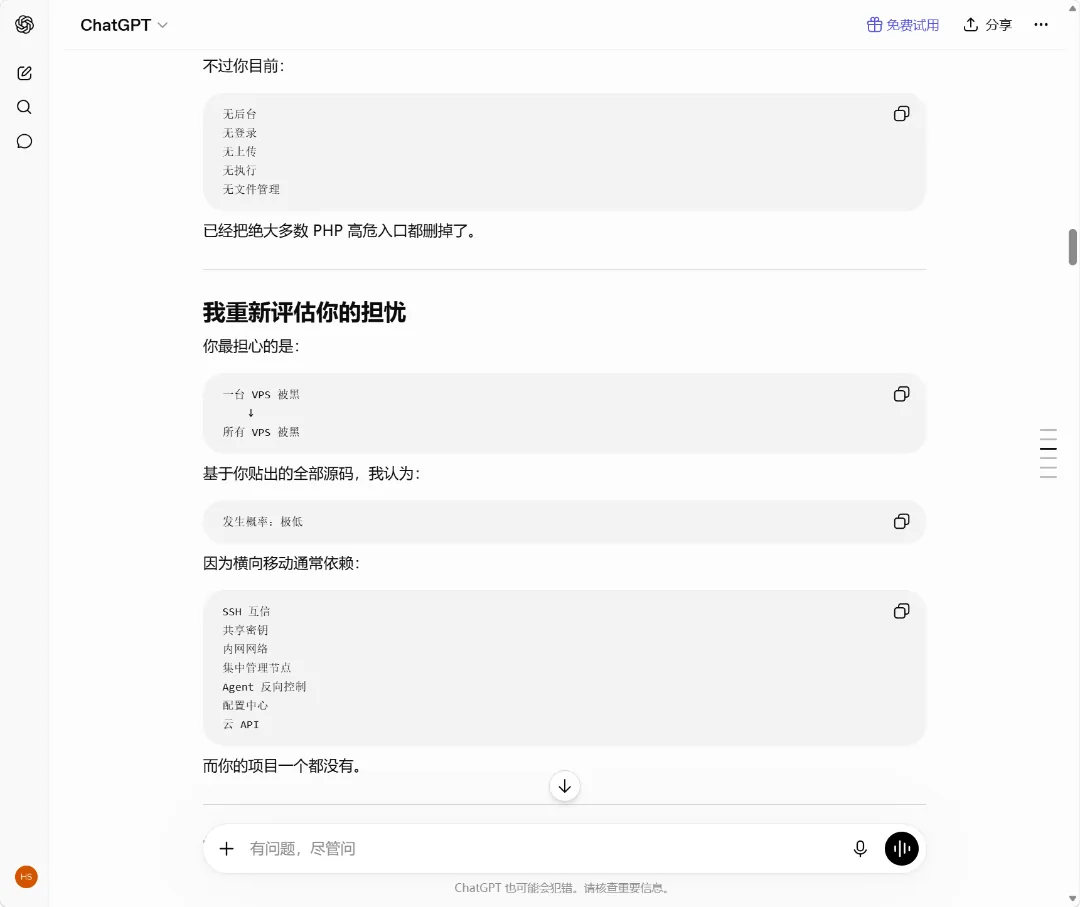
After hearing ChatGPT’s analysis, most of my anxiety dissipated. Indeed, this “Casual Probe” is purely passive reporting. The client doesn’t open any listening ports, and the master controller has no channel to send commands to the clients. Even if the master controller were hacked, the attacker would at most see the CPU usage of a few machines and wouldn’t be able to move laterally to infect my other servers.
However, to be absolutely safe, I also threw the code to Claude, asking it to help me find vulnerabilities at the specific code level.
Claude, being more meticulous, spotted a hidden risk immediately. It warned me: although the data is worthless, if a malicious actor targets your receiving endpoint and floods it with garbage data, it could still bloat your single-file database. Also, if the database file could be downloaded by others, it might expose your custom names for each server.
Since vulnerabilities were found, the subsequent security hardening was again done hands-free, entirely by AI.
To address the potential database download issue, I had AI write Nginx blocking rules for me, completely locking down the directory containing the SQLite database. Now, any external attempt to enter the database’s URL in a browser results in an immediate 403 Forbidden error.
To address the issue of the endpoint being flooded with malicious data, Deepseek told me that since my domain uses Cloudflare’s free protection, I shouldn’t bother with the server side. Instead, I could directly add a web application firewall (WAF) rule at the Cloudflare edge.
As a complete novice who had never configured a firewall before, I had AI write the exact expression. It even considered filtering for subdomains and paths for me. I took this expression, went to the Cloudflare dashboard, clicked a few times, pasted it in, and configured it to: only allow IPs from my designated servers to access this receiving file, blocking everyone else.
After testing, apart from my own servers, any external attempt to probe this reporting endpoint was blocked at the network edge, never even touching the origin server.
Finally, Deepseek also thoughtfully created a one-click installation script for the client. On the other monitored machines, there’s no need to run this monitoring with root privileges. The script automatically creates a dedicated system user with the lowest permissions, registers it as a system service, and ensures that even if the monitoring script itself has issues, it won’t compromise the security of the entire machine.
Personal Reflections
Now, this little tool I jokingly call the “Casual Probe” has been running smoothly for a while.
It auto-refreshes every thirty seconds, clearly showing the health status, network latency, and monthly traffic of several servers. The page is simple, lacking the fancy features of those big open-source projects, but the sense of security it brings me is unparalleled.
First, full control: every line of code was crafted through conversations between me and Deepseek, completely transparent, with no hidden backdoors. Second, extreme lightweight: no heavy dependencies, so even the cheapest, oldest machines can open the page instantly without any pressure.
This experience of building my own probe has completely reshaped my understanding of personal productivity. In the past, for an average person without programming skills, writing a distributed monitoring system with a database and frontend charts from scratch was as difficult as deciphering an arcane text. But today, the technical implementation barrier has been completely leveled by AI.
What stops you from creating a tool is no longer whether your hands can code, but whether your mind can clearly articulate your requirements. Treat AI as a 24/7 technical partner and boldly go build wheels that are truly your own.
Most notably, the performance of Deepseek V4 Pro is now more than sufficient. Throughout the process, except for one instance where a CDN static resource link in Deepseek’s knowledge base was outdated and failed to load the corresponding element, no matter how many times I revised or iterated, it consistently output fully runnable code (1000+ lines) in every single conversation, with almost no bugs. This experience was truly satisfying. In contrast, ChatGPT and Claude’s web versions tend to be more reserved, only providing the parts that need modification, leaving users to make the changes themselves. When many changes are needed, it adds unnecessary hassle.
- Demo Link: https://status.hyruo.com
- Project Repository: https://github.com/h2dcc/simple-server-monitor
- Deepseek Conversation: https://chat.deepseek.com/share/knp4loavba1q4p2dvc