Air Quality in Foshan in 2014
I extracted the monthly monitoring data for Foshan City for the entire year of 2014 from the website of the Ministry of Environmental Protection and conducted a rough statistical analysis. In 2014, Foshan had excellent air quality on 36% of the days and good air quality on 52% of the days, totaling 88%. There were 33 days with light pollution and 13 days with moderate pollution.
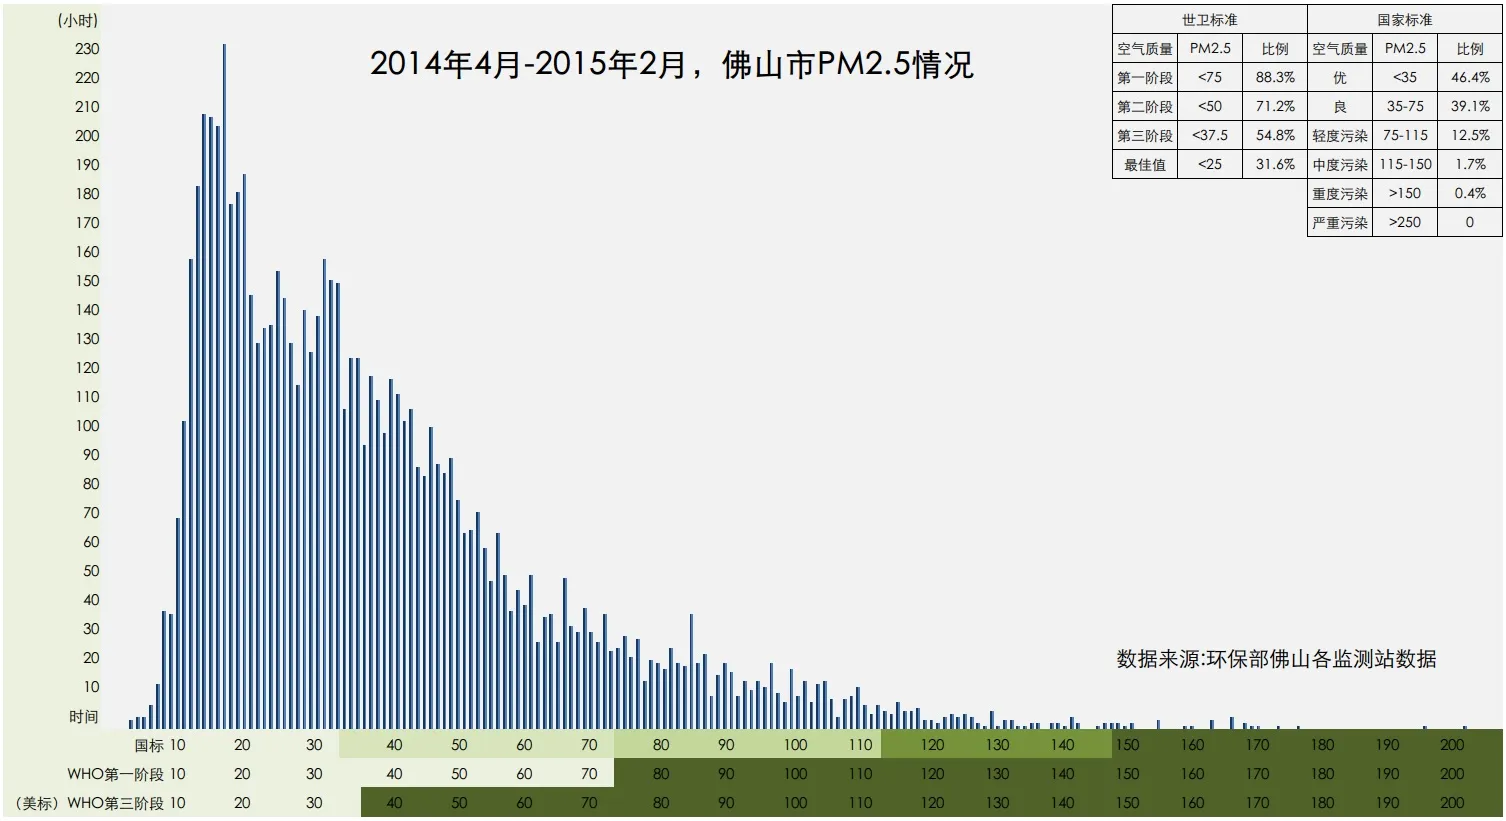
Additionally, from the website http://air.epmap.org/ , I downloaded all the monitoring data from various environmental monitoring stations in Foshan from April 11, 2014, to March 5, 2015, and performed a simple statistical analysis as follows:
It can be observed that although Foshan is the city with the worst environmental conditions in the Pearl River Delta, even under the World Health Organization's Phase I (current national standard) PM2.5 control plan, Foshan's PM2.5 compliance rate for the entire year is close to 90%. However, if the U.S. standard (WHO Phase III standard) is applied, Foshan only meets the standard 55% of the time.
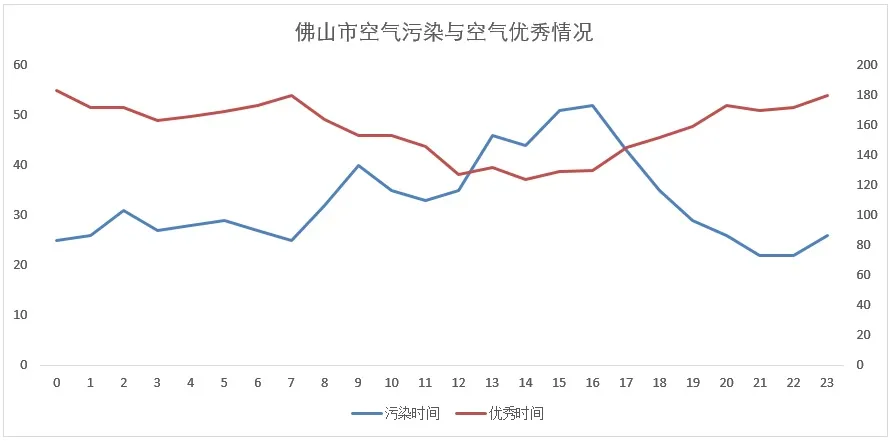
There was a lot of data downloaded, but after analyzing the two charts above, I realized that I was overthinking it. At the current level of economic development, if a city's air quality meets standards 90% of the time, what is there to worry about? There's really no need to dwell on this. Finally, I compiled statistics on the periods of local air pollution and excellent air quality for reference during outdoor activities.
#aqi #pm2-5 #foshan #air pollution